How to produce a research report


A research report is a document that presents the results of an original study. In the past, research reports were published as PDFs. But as you will see from the examples in this guide, the best research reports today are published as highly visual, interactive web pages.
Indeed — over the last five years, we’ve seen an explosion of research reports and white papers from businesses and NGOs.
But a greater volume of reports can only mean one thing: even more difficulty getting people to actually read them. The UN itself recently reported on how few of its members read its own reports. Similar challenges with cut-through affect everyone in digital publishing — making clear, succinct, and instantly engaging research reports essential.

This guide covers:
- Research reports defined
- What a research report should include
- Example of a branded research report: Tripadvisor and Group Black
- 8 steps to build your research report
- Research report FAQs
- Three free templates to start your own research report
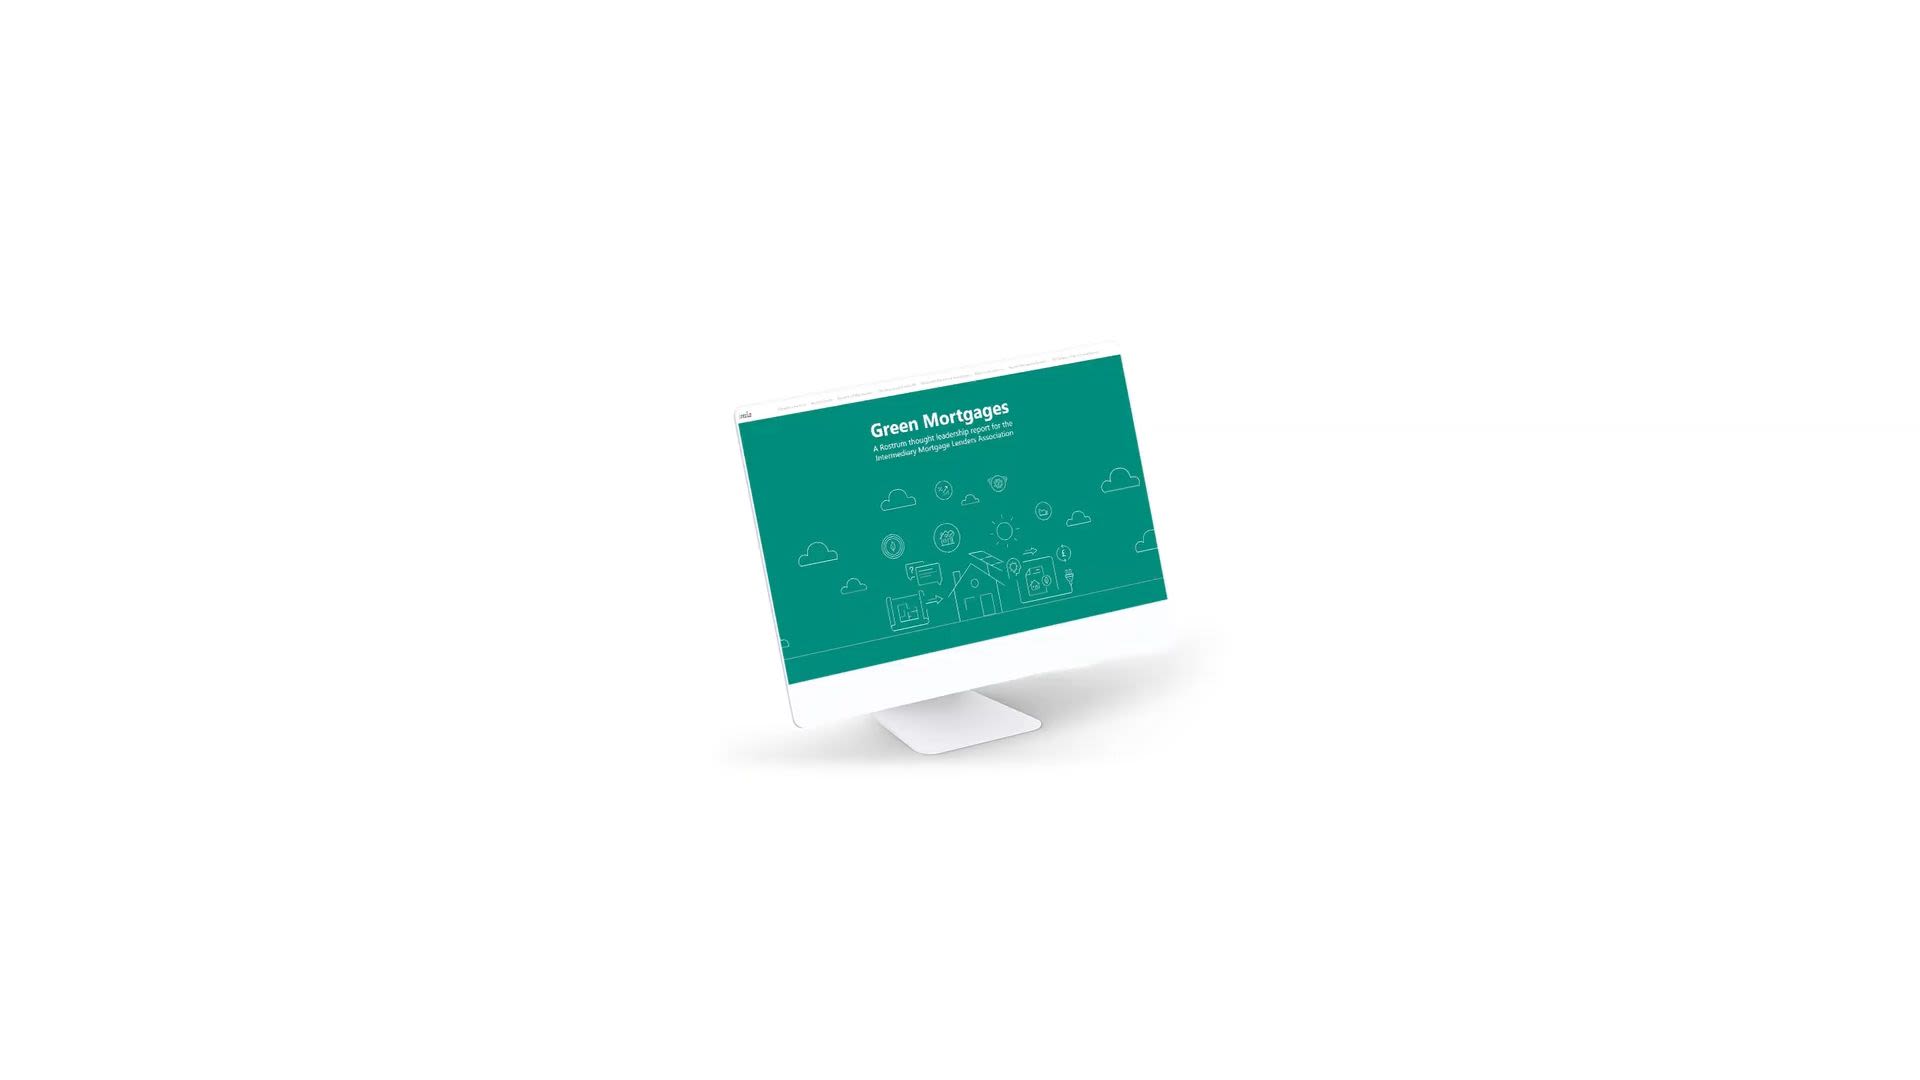
This Green Mortgages report by IMLA was made with the assistance of digital agency Rostrum. It’s a beautifully designed report, rich with infographics and data visualisations.
This guide covers:
- Research reports defined
- What a research report should include
- Example of a branded research report: Tripadvisor and Group Black
- 8 steps to build your research report
- Research report FAQs
This Green Mortgages report IMLA was made with the assistance of digital agency Rostrum. It’s a beautifully designed report, rich with infographics and data visualisations.

The biggest SaaS companies are also investing in reports, including Slack, and Twilio.
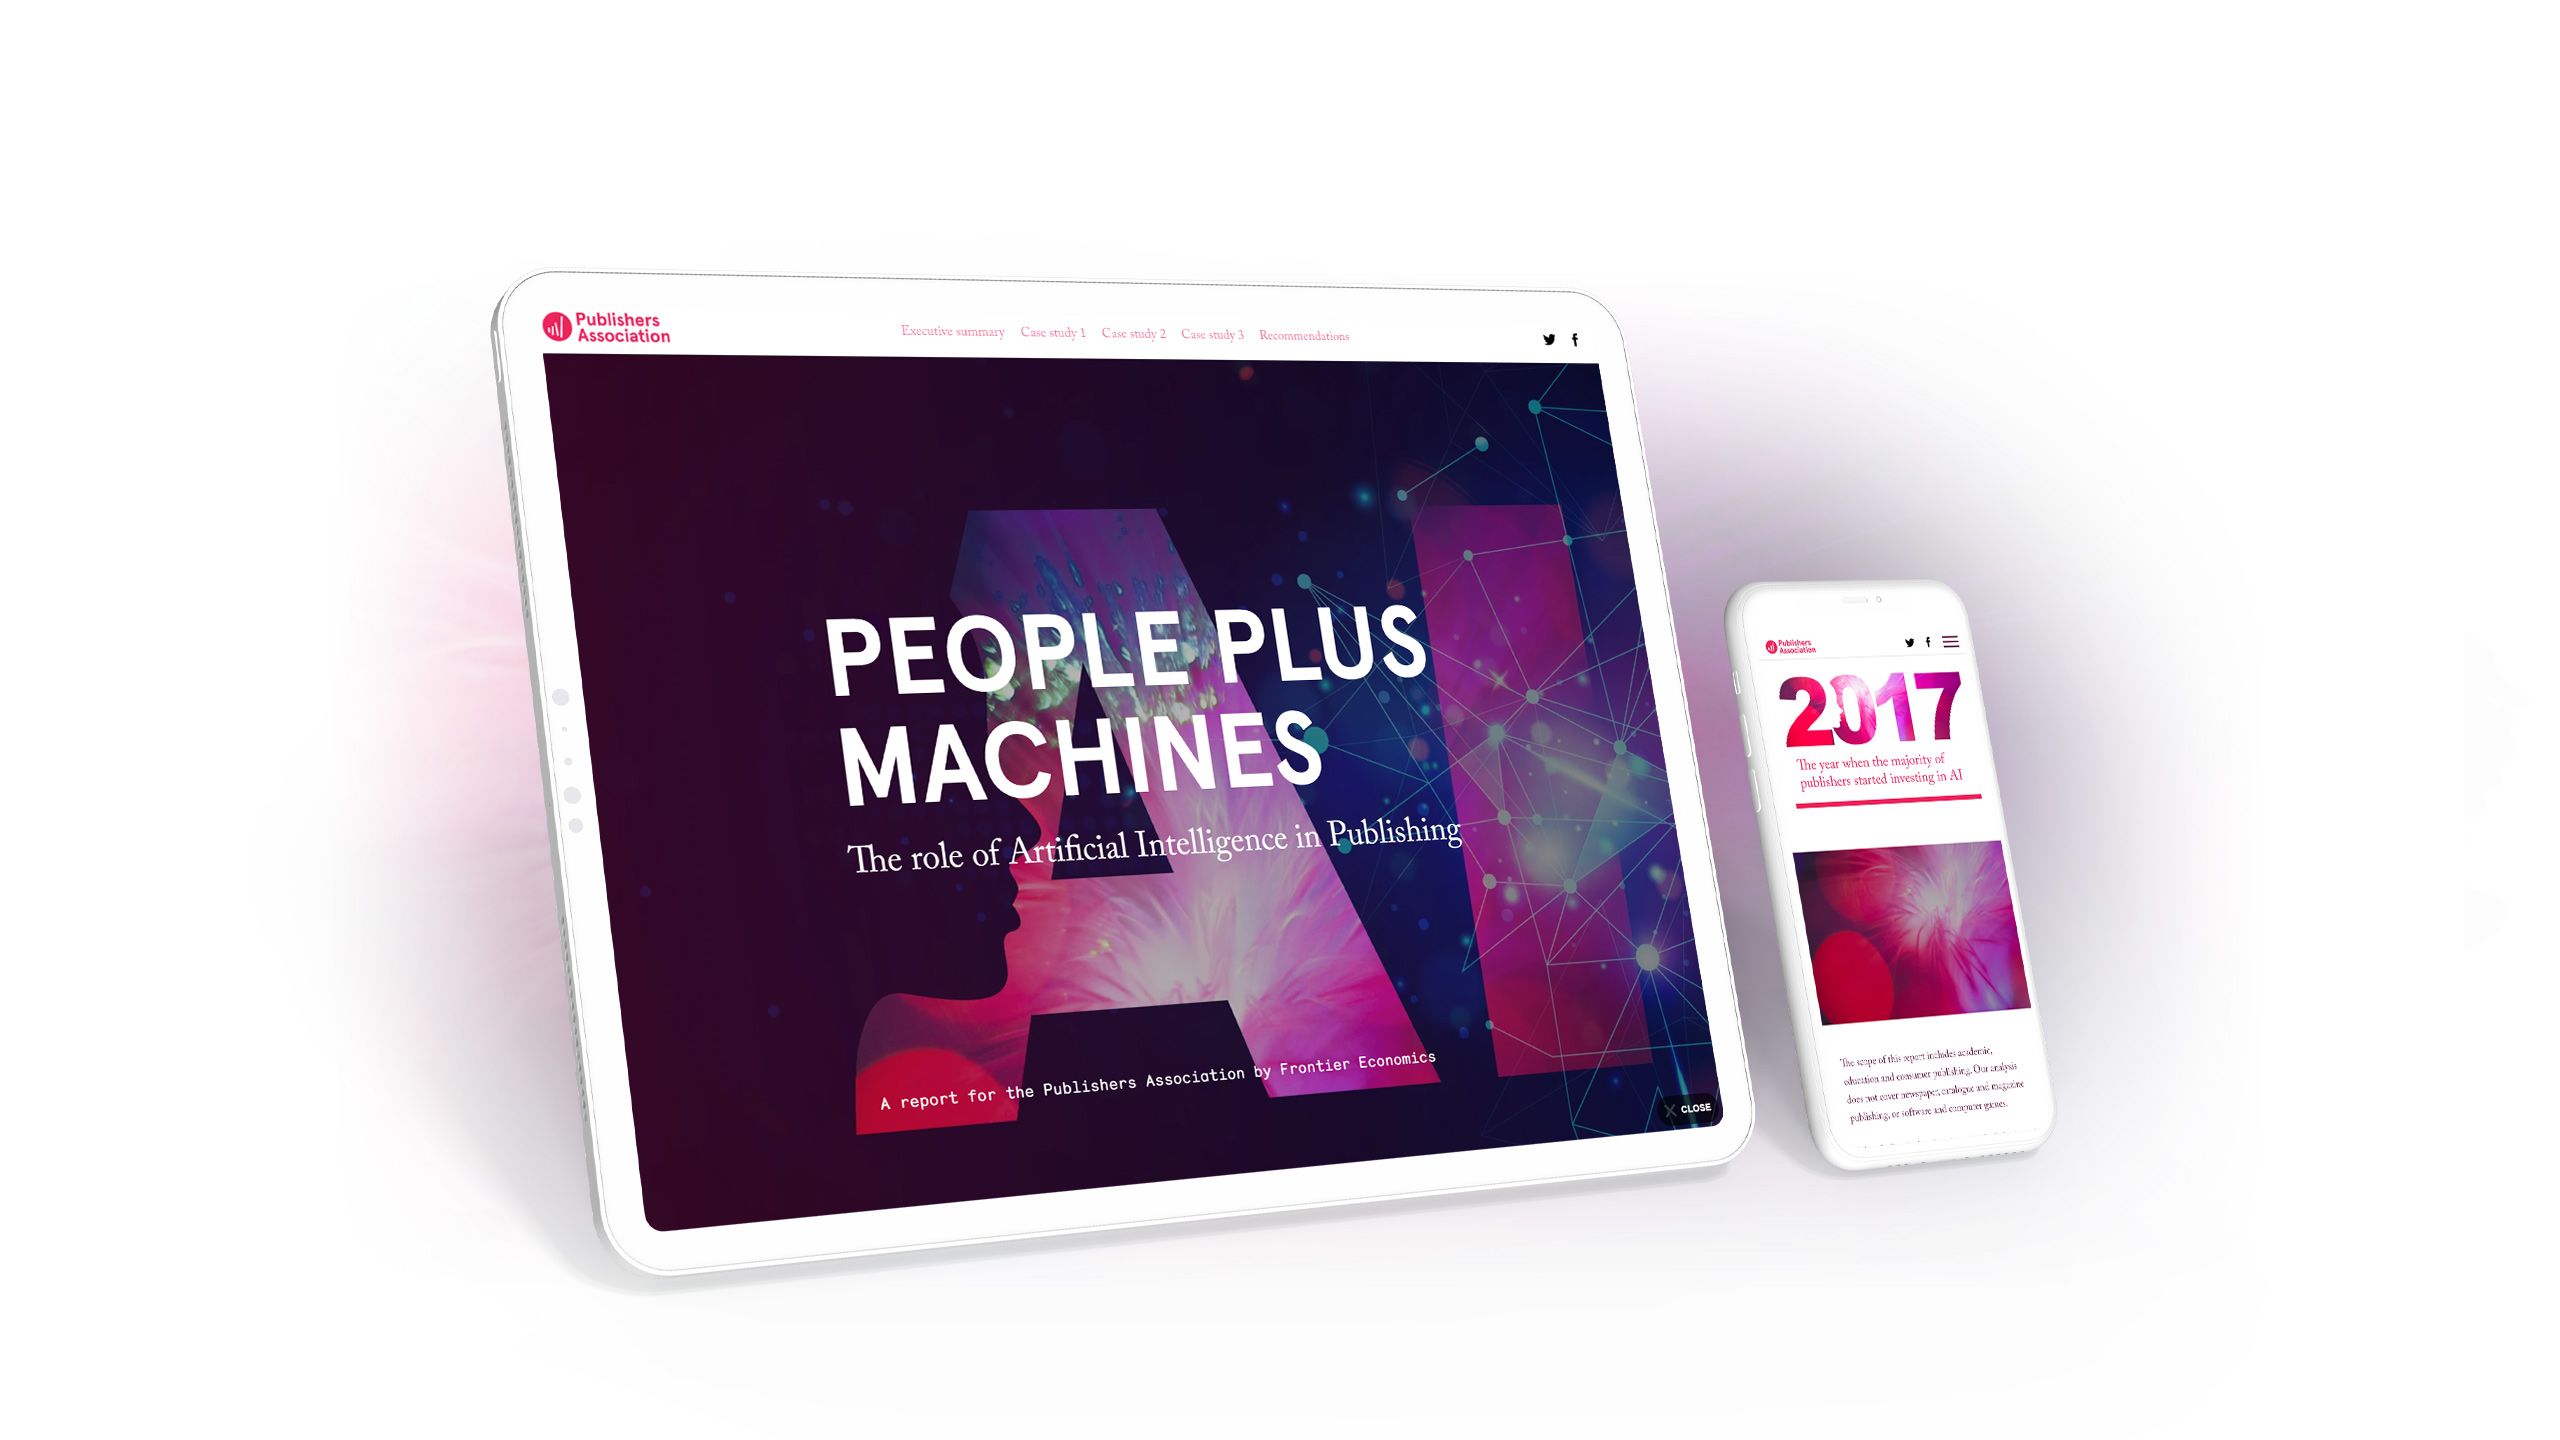
It's not only businesses publishing reports. The 'People Plus Machines' white paper below, from the Publishers Association, dives into an initiative on the future role of artificial intelligence in the publishing industry.

Start creating with Shorthand
It's the fastest way to publish beautifully engaging research reports, internal comms, and more.


What is a research report?
A research report is an in-depth document that contains the results of a research project. It includes information about the research topic, the research question, the methodology used to collect data from respondents, the results of the research, and the conclusion of the researcher.
The report also includes information about the funding source or partnerships for the project, if applicable. The purpose of a research report is to communicate the findings of research studies to a wider audience. The report should be clear, concise, and well-organised so that readers can easily understand the information presented.
Many research reports are formally structured, with headings and — for PDFs — page numbers,
As mentioned above, research reports have traditionally been published as PDFs, but are increasingly moving to interactive content.
The rise of the research report
Why do brands and organisations invest in research reports and white papers?
Most of their teams aren’t filled with scientists or academics, and their readers aren’t usually trawling research databases for help with their work.
The reason is — let’s be blunt — most content published on the web underwhelms.

Secretary General of the UN Antonio Guterres explained the growing volume — but lower readership — of UN reports.
Secretary General of the UN Antonio Guterres explained the growing volume — but lower readership — of UN reports.
Even on the most well-attended blogs, organic traffic and dwell-time generally remains flat. CTAs are stubbornly un-clicked. The common fate of most content is to gather dust almost immediately after publication.
There are many reasons for this. Search has clearly become much more competitive. It’s difficult for most organisations to get their ordinary blog content ranked anywhere near the first page.
Social media, too, has long been a ‘pay-to-play’ environment, with only extremely brave (or foolish) content teams banking on their posts going viral.
The move to quality over quantity
To meet these challenges, the most successful content teams have committed to producing high-quality content. Rather than pumping out content-for-content’s-sake — which, to be frank, few humans actually want to read — these teams produce content that helps, informs, and delights their readers.
High quality content takes a range of forms, including ebooks, longform content, all-encompassing ‘skyscraper’ guides, and feature stories. It's often highly visual, immersive, and multimedia, and can include elements like audio, video, and interactive infographics.
Because this content is produced to genuinely help the reader, it’s much more likely to be read, shared, and — critically for SEO — linked. Readers tend to stay on the page for longer, another key metric for SEO. They’re also more likely to click calls-to-action.
This is borne out by our customers at Shorthand. After nine months using Shorthand as an investment in producing high quality content, Imperial College London’s feature stories saw 142% higher average unique pageviews and 50% higher average time on page.
Honda, too, saw the average site dwell time increase by 85% after transitioning to publishing immersive, high quality digital stories (again, built with Shorthand).
Clearly, quality content gets better results. But it isn’t easy to make. It requires investment, dedication, and clear goals.
In this guide, we focus on one of the best-performing genres of quality content — the research report, which has become the not-so-secret weapon for the world’s leading content teams.
Here's what your research report should include
Online research reports should include: navigation, an introduction, a research review, methodology, findings, discussion, and a conclusion.
For most organisations, research reports will sit somewhere between marketing and academia.
On the one hand, they need to be as rigorous, scientific, and statistically literate as any published research paper. There's no point — and real reputational risk — in publishing a sloppy, factually inaccurate report.
On the other hand, most research reports outside of academia are published to support sales and marketing efforts. For some companies, such as market research firms, these reports are the product itself. Research reports need to be beautifully produced, clearly written, and have clear takeaways for the reader.
But unlike academia, there's also no one-size-fits-all structure. With that in mind, here are some common sections to keep in mind when writing a research report.
1. Navigation
For print reports and PDFs, it's common to include a table of contents after the title page. But if you're producing your report natively for the web — which we highly recommend — then it's worth giving your reader a way to jump back and forth. At Shorthand, we think the PDF is a tired format, and we make it simple to create a custom top navigation, which allows readers to easily browse through longer content.
2. Introduction section
For research reports, your introduction is a good opportunity to outline the scope of your work. Note your research questions, research design, and research methods, establish context and significance, and add any background information you think might be relevant.
3. Literature review
These take a specific form in academic research, but outside of academia, it might pay to show some awareness of other research that has been conducted in your space.
4. Research methodology
Again, this doesn't need to have all the rigour of an academic journal article. But to establish credibility, it pays to outline how you produced and analysed the qualitative or quantitative data at the heart of your report. For example, if you collected your data from an online questionnaire, it pays to point this out.
5. Research findings
The most important part of your report will be your results section, covering of your findings. As we discuss below, for quantitative research, this section should be rich with data visualisations and infographics. This will likely be the most compelling part of the report for your readers.
6. Discussion section
This is where you can contextualise the results, and offer an argument about the significance of the data. In many research reports for brands, this section and the 'research findings' sections are merged.
7. Conclusion
This is where you can pull the various threads of your research report together. This will also allow you to carefully advance an argument about the significance of the research, and what it suggests about the future.
Branded report example: Tripadvisor and Group Black partnership


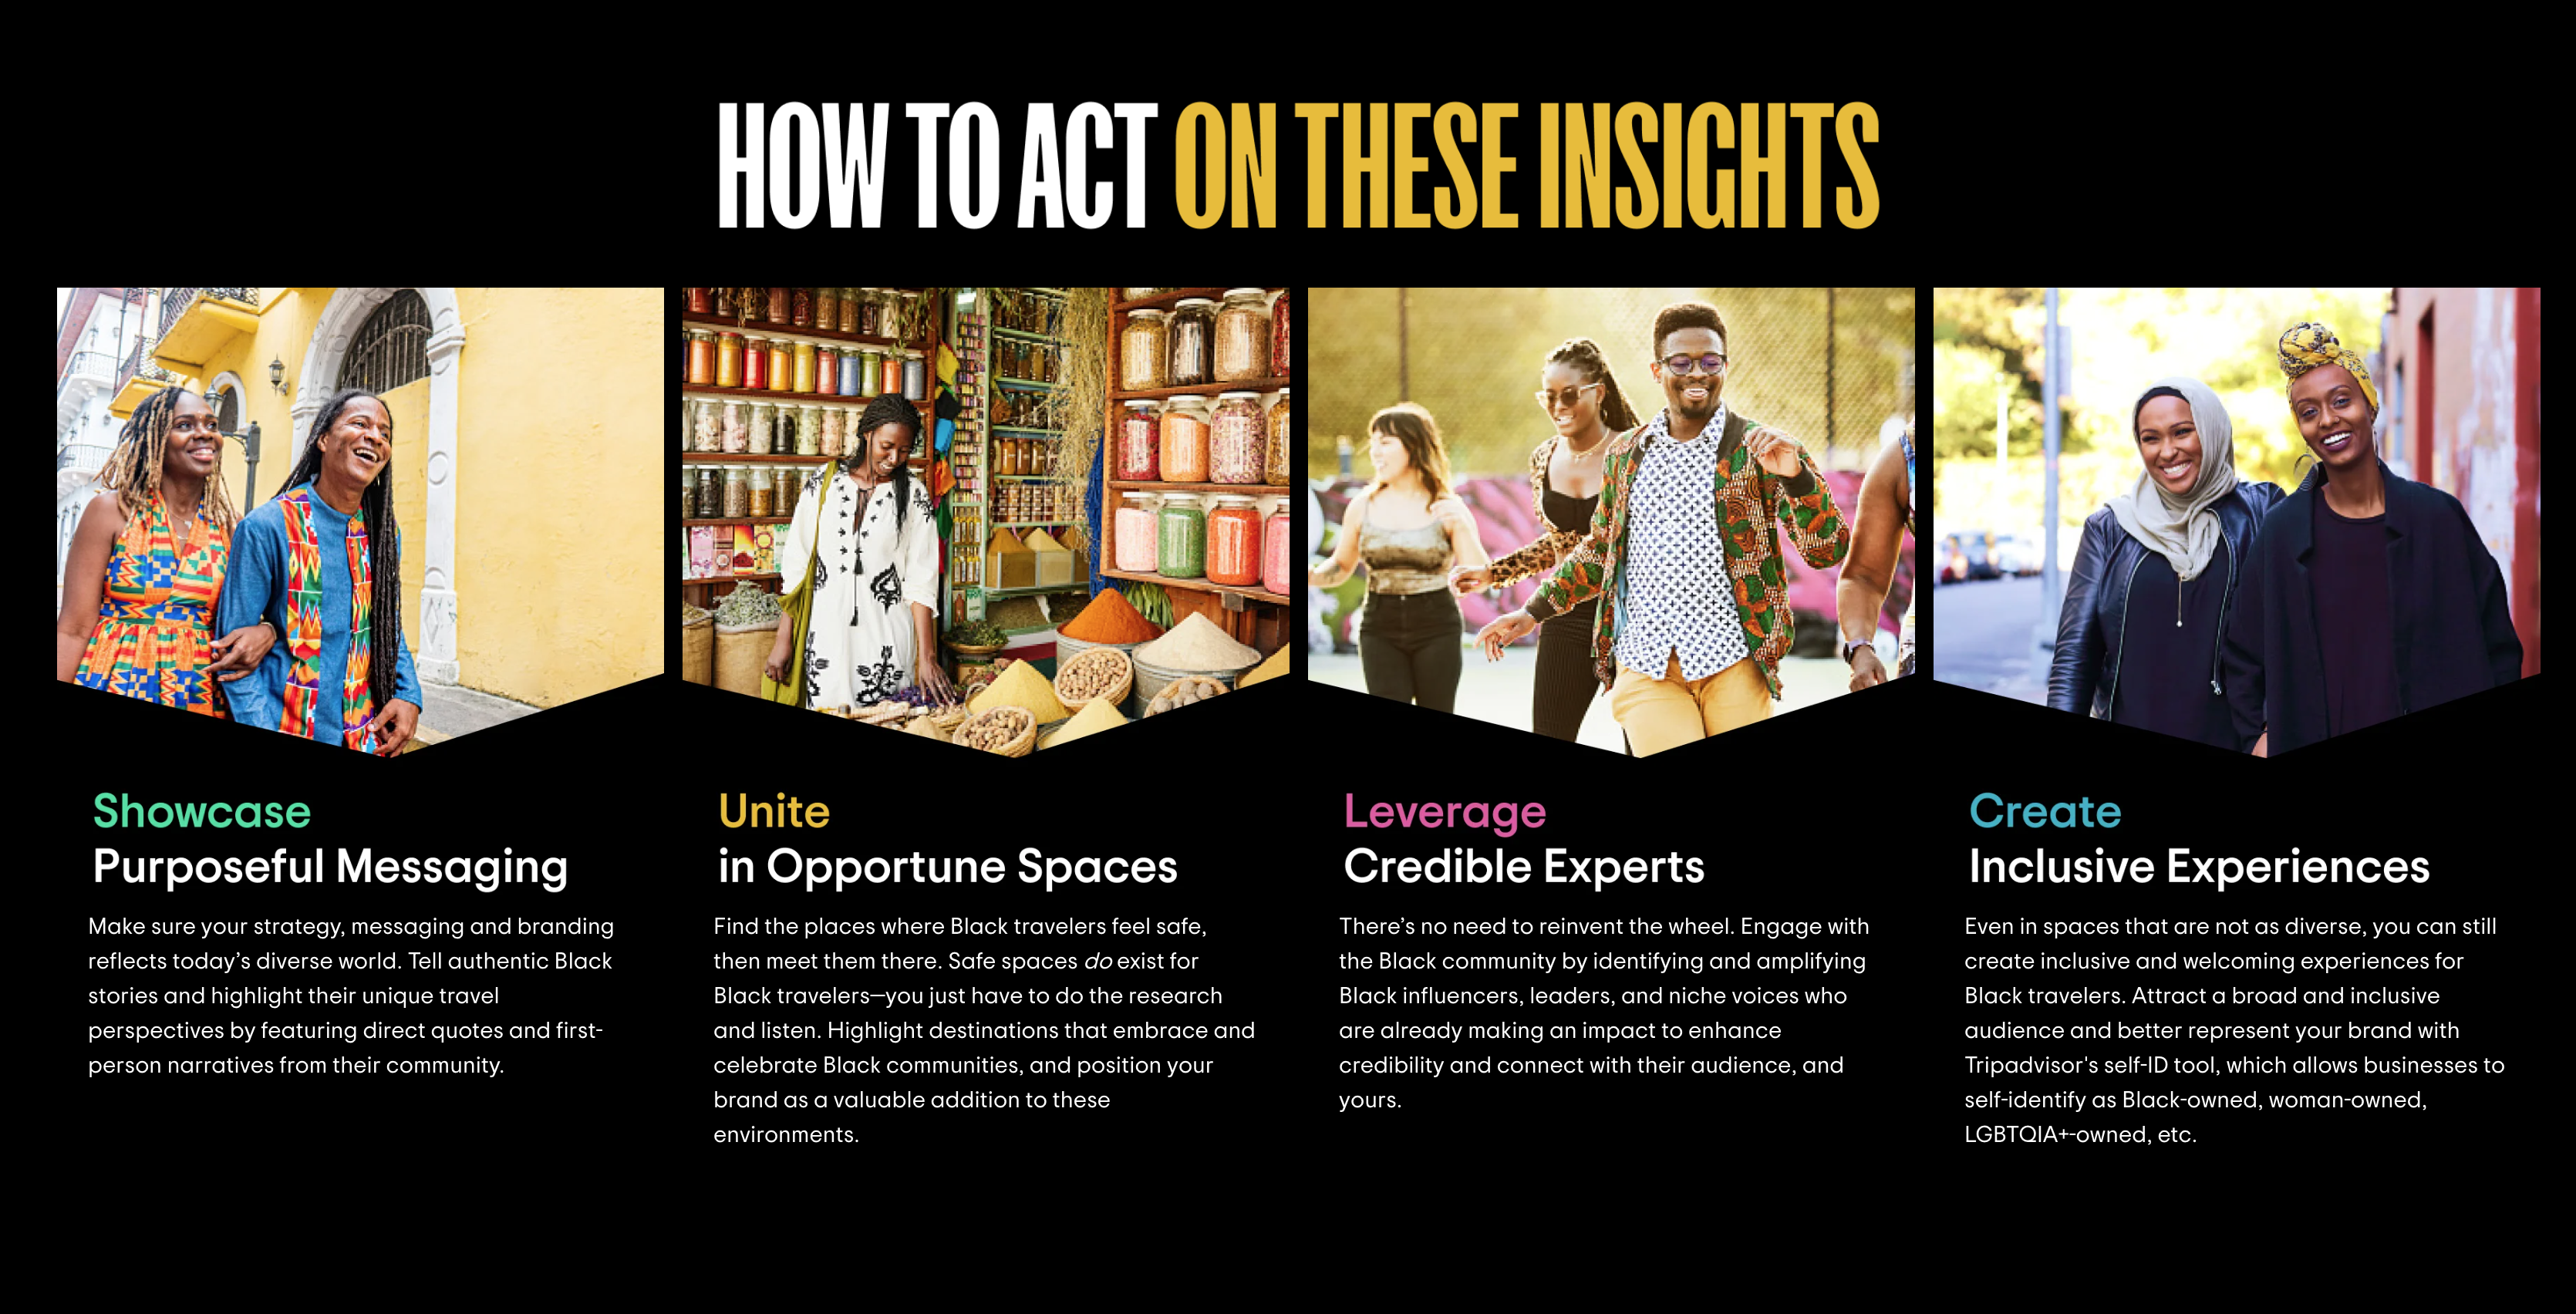
‘Black Travel Today’, a partnered research report by Group Black and Tripadvisor, is an example of an excellent branded research report. With striking travel imagery, it keeps readers engaged while presenting its findings clearly and succinctly through data cards, charts, and maps.
After surveying Black travellers, it presents findings on how they choose safe destinations, how they seek cultural connections, and the types of destinations they prefer. It is an eye-opener about the experience of Black travellers in North America, while also hitting its commercial goal — outlining the business opportunities for travel brands to build connections with Black travellers.
In line with the inclusions above, it has:
- A strong introduction by way of a short entry spiel and an executive summary.
- A research and methodology section at the bottom.
- Clearly showcased research findings, with charts, cards, and a map.
- Discussion sections. These are clearly signposted, with bulletpoint ‘takeaways’ at the end of each section.
- A strong, and constructive, conclusion, with four clear ‘how to act on these insights’ steps, which are useful tips that add value for the reader.

8 steps to build your own research report
1. Trust the process

More than any other genre of content, research reports require consistent — and persistent — project management. Unlike blog posts or case studies, a research report can't be turned around in a week or two.
This can be daunting for teams that haven't published research before — and daunting projects have a way of getting postponed.
As with any large project, the best thing to do is create a realistic plan. This plan will need to include all the different stakeholders — including writers, designers, and management — and factor in their likely contribution. Part of this will involve taking a realistic look at their future commitments.
Plan time for data collection, drafting, data storytelling, design, editing, and writing. This will all take longer than you think.
Once you've established your plan — and once it's been signed off by all relevant stakeholders — stick to it. Trust it. Try not to deviate too much from the process.
2. Produce fresh data

Data is the core of any research report. It will be the stuff that gets quoted and highlighted, and it will be what earns your report any backlinks or extra additional coverage or earned media.
Without fresh data, your report is just another bunch of unsupported assertions — and there are more than enough of those on the web already.
The way you get fresh data will depend on what exactly you’re researching. You might be analysing usage patterns in software. You might be conducting interviews of customers or a professional cohort.
It could be anything — but whatever it is, make sure it’s fresh and unique to your report.
If you're looking for more examples and inspiration, check out our guide on how to get started with data storytelling, as well as our post on 8 examples of powerful data stories.
3. Don't cut corners with the data (or anything else)
Odds are, your research report isn’t going to be peer reviewed, and it won’t be published in a scientific journal. But this doesn't give you an excuse to cut corners.
A research report is a form of ‘anchor’ content. It is specifically produced to earn attention for your brand.
But attention can swing both ways. If people notice mistakes or major errors in your report, then this will impact the reputation of your organisation.
What are the most common mistakes for research reports?
The most common areas where research reports fall down are in data collection, data analysis, and data visualisation. Make sure you have someone sufficiently numerate to double-check your process and results.
4. Establish the reputation of your brand

A research report is an invaluable way to establish your brand as a leader in your field. This is important for SEO and engagement, and it's also influential in the decisions your audience makes — whatever your organisation is trying to achieve.
Potential leads are far more likely to take action with organisations they trust. You can read more about that in our guide to brand storytelling.
But it’s also important for the buying process — whatever it is your organisation is trying to sell.
Simply put, potential leads are much more likely to take action with organisations that they trust. This is true for businesses — but it is also true for nonprofits, universities, and government agencies.
You can read more in our guide to brand storytelling.
5. Don't sell

The most effective research reports are presented as a neutral interpretation of data — without any embellishment or sales flourishes.
Ideally, you want your readers to engage with your report as an accurate representation of the world. You want them to trust it — and trust you. Anything that betrays your agenda will weaken this trust, and make the report less effective.
Obviously, your report isn’t neutral. It’s an investment in a piece of content. And, like anything you publish, it should have a content plan and an end goal in mind.
But, done well, a professionally produced report will accomplish those goals — including better engagement, reputational gain, and lead generation — without you needing to aggressively sell your product or service.
6. Visualise your data

After collecting data and analysing your findings, you need to consider your data visualisations. This includes any relevant charts, graphs, and maps.
Your data visualisations will be the centrepiece of your report. They will likely be the parts of your report that readers skip to. They’re also likely to be the information readers retain and share.
With this in mind, they're worth doing right. There are many different data visualisation tools out there, and there's no single best approach.
Read more about data visualisation in our guide to effective data journalism.
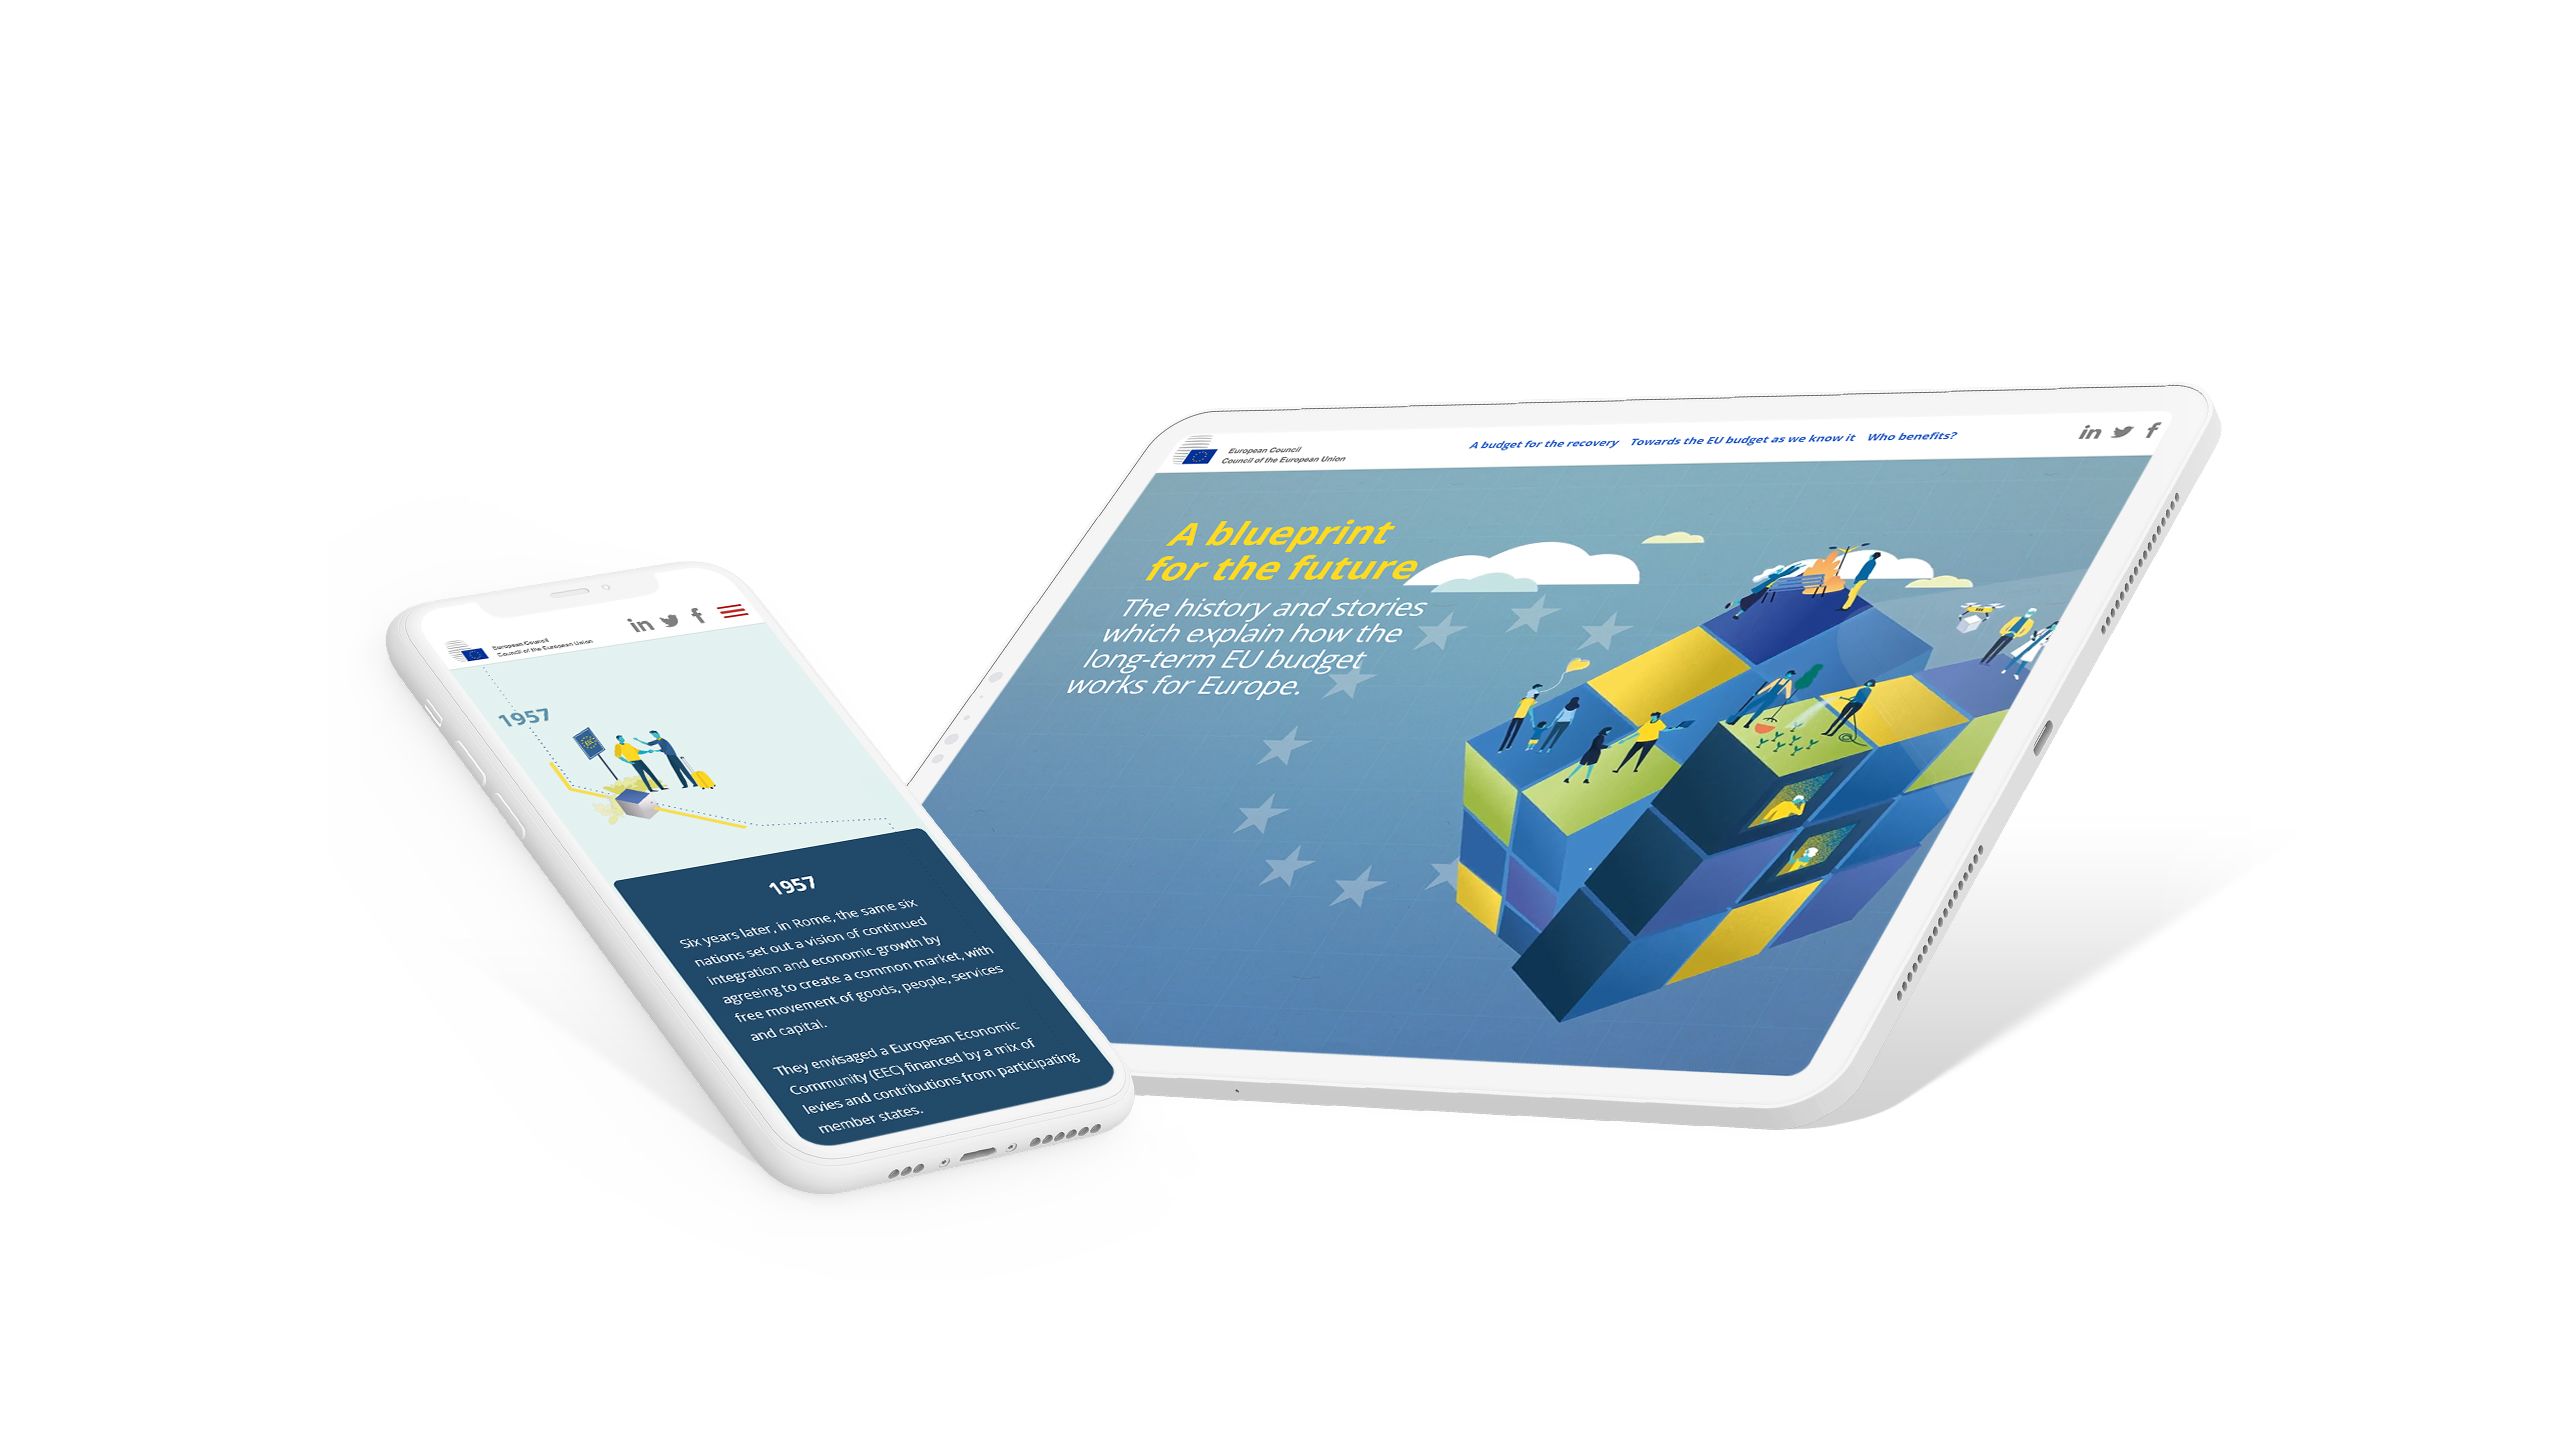
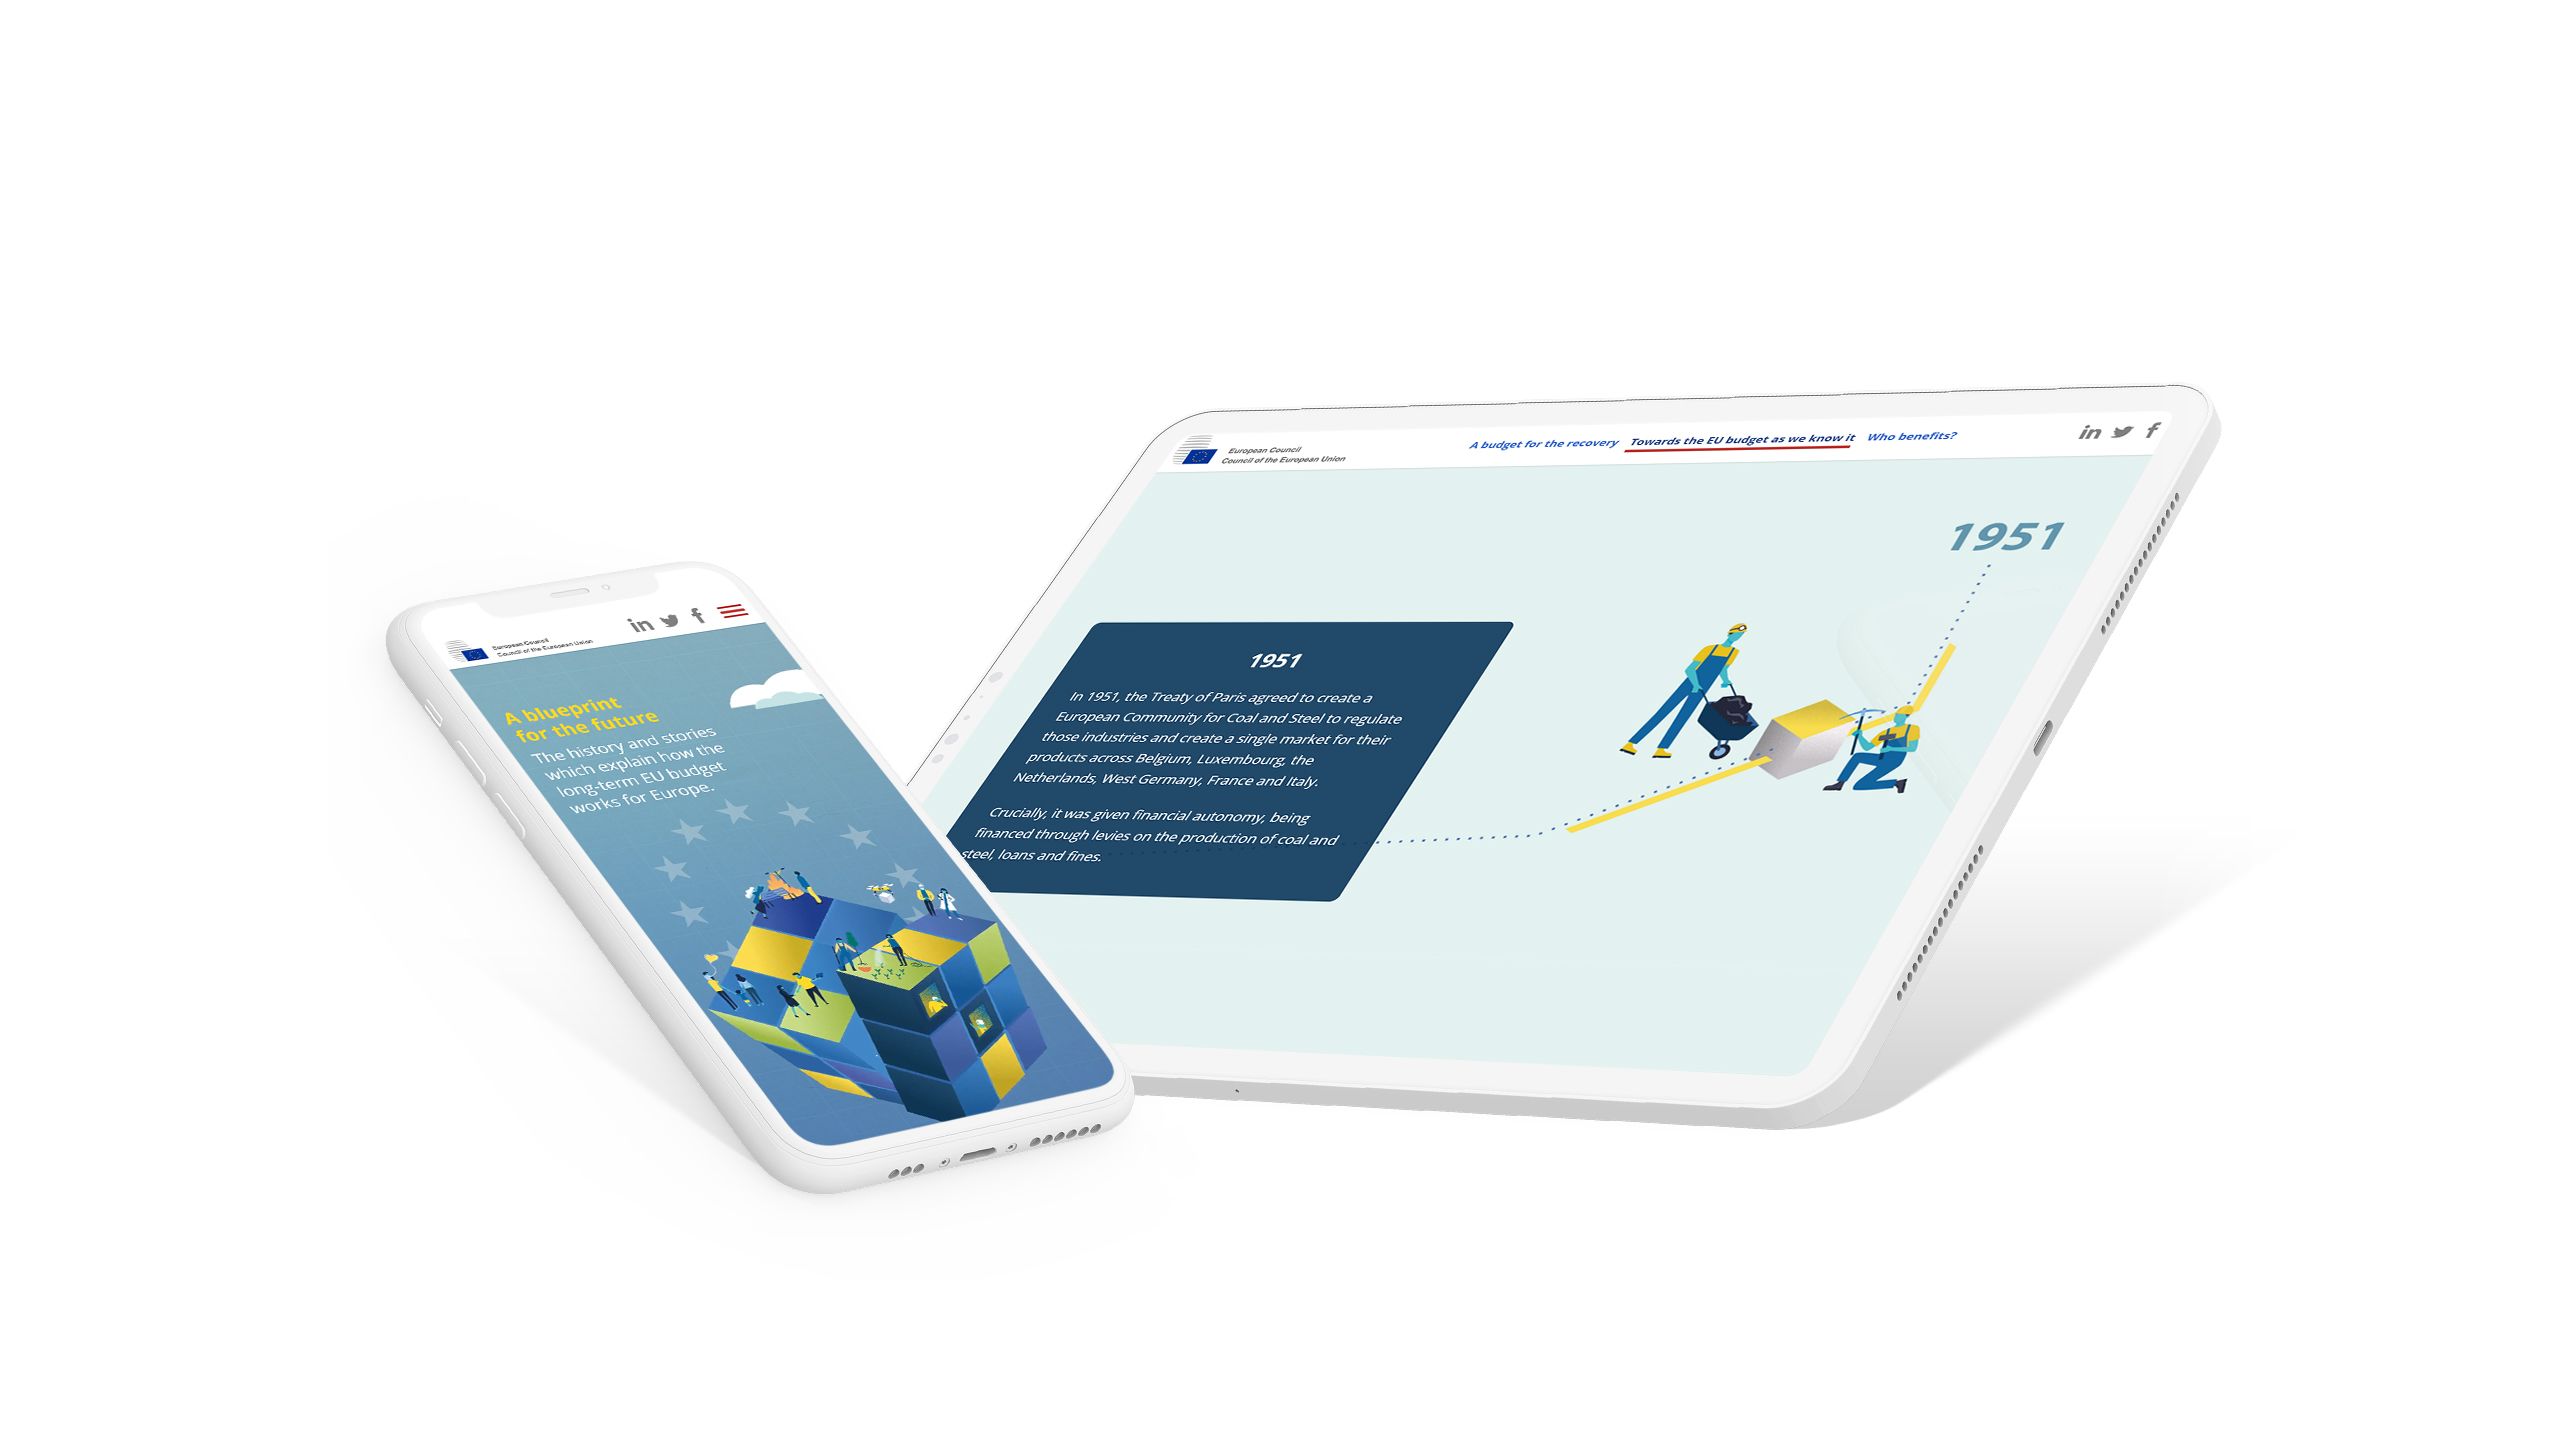
Some reports will benefit from a chart or interactive map that readers can click and interrogate in the browser. Others will benefit from scroll-based animation, as used in this story from the Council of the European Union.
One constant across the best research reports on the web, though, is the use of interactive data visualisation. While it was common in the past to use static images of charts and graphs — usually recycling visual assets used in the PDF version of the report — this approach is gradually being supplanted by more advanced techniques.
Some of these data visualisation techniques will require web design and developer resource. Others — like Shorthand itself — will be easier to use out-of-the-box.
7. Put PDF last

PDFs are an extraordinarily common method of publishing research reports — even today. Indeed, some organisations publish their reports as ‘PDF-first,’ with any web publication treated as a poor cousin.
This is the wrong approach. And with the rise of new web technologies and more powerful web browsers, it’s also extremely outdated. For better results, we recommend producing reports first and foremost for the web.
Web-based reports have many distinct advantages over the PDF, including:
- They can be read on all screen sizes, including phones. No pinching or zooming required.
- They can be easily indexed and optimised for search.
- They can include interactive data visualisations and animations, video, and high resolution images. Even the most beautiful PDF can't compete with a visually-immersive digital story.
- They are easier to share. A high-resolution PDF is simply too clunky to share on all channels (including social media).
If you want you to read more about the problems with the PDF, check out our guide on why the PDF is falling out of favour.
8. Get inspired by the best

With the rise of digital storytelling platforms, the calibre of published research reports on the web has improved markedly. That means that there are plenty of excellent reports to check out for inspiration.
At Shorthand, we’ve collected some of the best reports — including thought-leadership reports, annual reports for businesses and NGOs, and original research — in our collection of featured stories.
Research report FAQs
How long should my research report be?
The ideal length of a research report depends on the topic and scope of your work. To keep readers engaged and prevent them from clicking away, aim to include all seven ‘musts’ listed above — as succinctly as possible. If you’re aiming for maximum engagement (and SEO success) with a longform report, a range of 1,500–4,000 words tends to be the content sweet spot — provided you include plenty of media and visualisations to break up the text. Check out our longform content guide for tips.
Can I turn my research report into a blog post?
Absolutely! Blog posts, news articles, and opinion pieces based on your report are excellent ways to build interest and drive traffic to your work. Just make sure your blog is fit for the modern web — check out our guide to brand blogging.
What tools are best for data visualisation?
There are plenty of great data visualisation tools available to researchers and creators. Examples include Tableau, Mapbox, Flourish, Venngage, Piktochart, and Shorthand’s own Charts. These tools are covered in our guide to powerful data storytelling.
Where can I view more great examples of research reports and data storytelling?
The Craft has shared eight powerful examples, and you can also explore Shorthand’s featured data storytelling examples, which offers a regularly updated library of inspiring work.