
11 dynamic multimedia content examples


Ever opened a webpage and found an impenetrable wall of text waiting for you? It’s overwhelming and visually exhausting — not to mention boring.


by Kiera Abbamonte
by Kiera Abbamonte
Content marketing professionals and publishers alike turn to multimedia content to break up those big walls of text, communicate information for different learning styles and content preferences, and create a more engaging user experience overall.
But bespoke multimedia content creation historically required dedicated developer bandwidth — something few content teams have the time or resources for.
Today, new digital platforms have brought multimedia content creation into the realm of possibility for nearly every content team. Platforms like these make it easier for designers, writers, and editors to create multimedia stories without the need for coding experience or developer time.
Here, we cover:
What do the BBC, Tripadvisor, and Penguin have in common?
They craft stunning, interactive web content with Shorthand. And so can you! Create your first story for free — no code or web design skills required.
Sign up now.
What is multimedia content?
Multimedia content is a fancy name for a simple concept: content that includes multiple types of media — be it text, images and graphics, video, or audio.
In practice, multimedia content can look really different depending on the media content used, the creator’s goal for the content, and the audience. It could be a blog post that combines text and images, a podcast with a written summary, interactive content… you name it.
Spoiler alert: you’re consuming multimedia content right here — welcome!
The key is that by drawing on multiple types of media, multimedia storytellers can:
- Create more engaging content
- Appeal to audience needs and preferences with diverse digital media
- Tell stories via the most effective medium for different kinds of information
If you’re looking to include multimedia content in your digital marketing strategy, you can consider creating it as a new, standalone content lane. Or, you can ‘layer’ multimedia elements onto the content you’re already making.
Adding a visual element to a written white paper — say an eye-catching chart — can help make the content both more digestible and more engaging. Adding interactive elements helps keep audiences engaged in the story. And offering content as an audio podcast, a video, and a written summary helps appeal to all the different ways your audience consumes content.
Types of multimedia content
Multimedia content includes a combination of any two or more types of media. These typically fall into four brackets:
- Text: often the backbone of the narrative for content like webpages, blog posts, ebooks, articles, white papers, etc. and accentuated with visual or audio elements.
- Images and graphics: from standard photography, illustrations, and graphic design elements to infographics, slideshow presentations, interactive maps, impressive data visualisations, and graphics for social media platforms, imagery breaks up text and makes certain kinds of information (like data) more digestible.
- Audio: podcasts, narration, and even background music all help to make content more immersive and give audiences options for how they consume content.
- Video: GIFs, animated explainer videos, video tutorials, live video, video clips, and webinars are just a few examples of video frequently used to build engaging multimedia content.
Our favourite examples of multimedia content
To show what this looks like in practice — and get you inspired to build your own — we pulled together 11 of our favourite immersive, bespoke multimedia content examples, all built with the help of Shorthand.


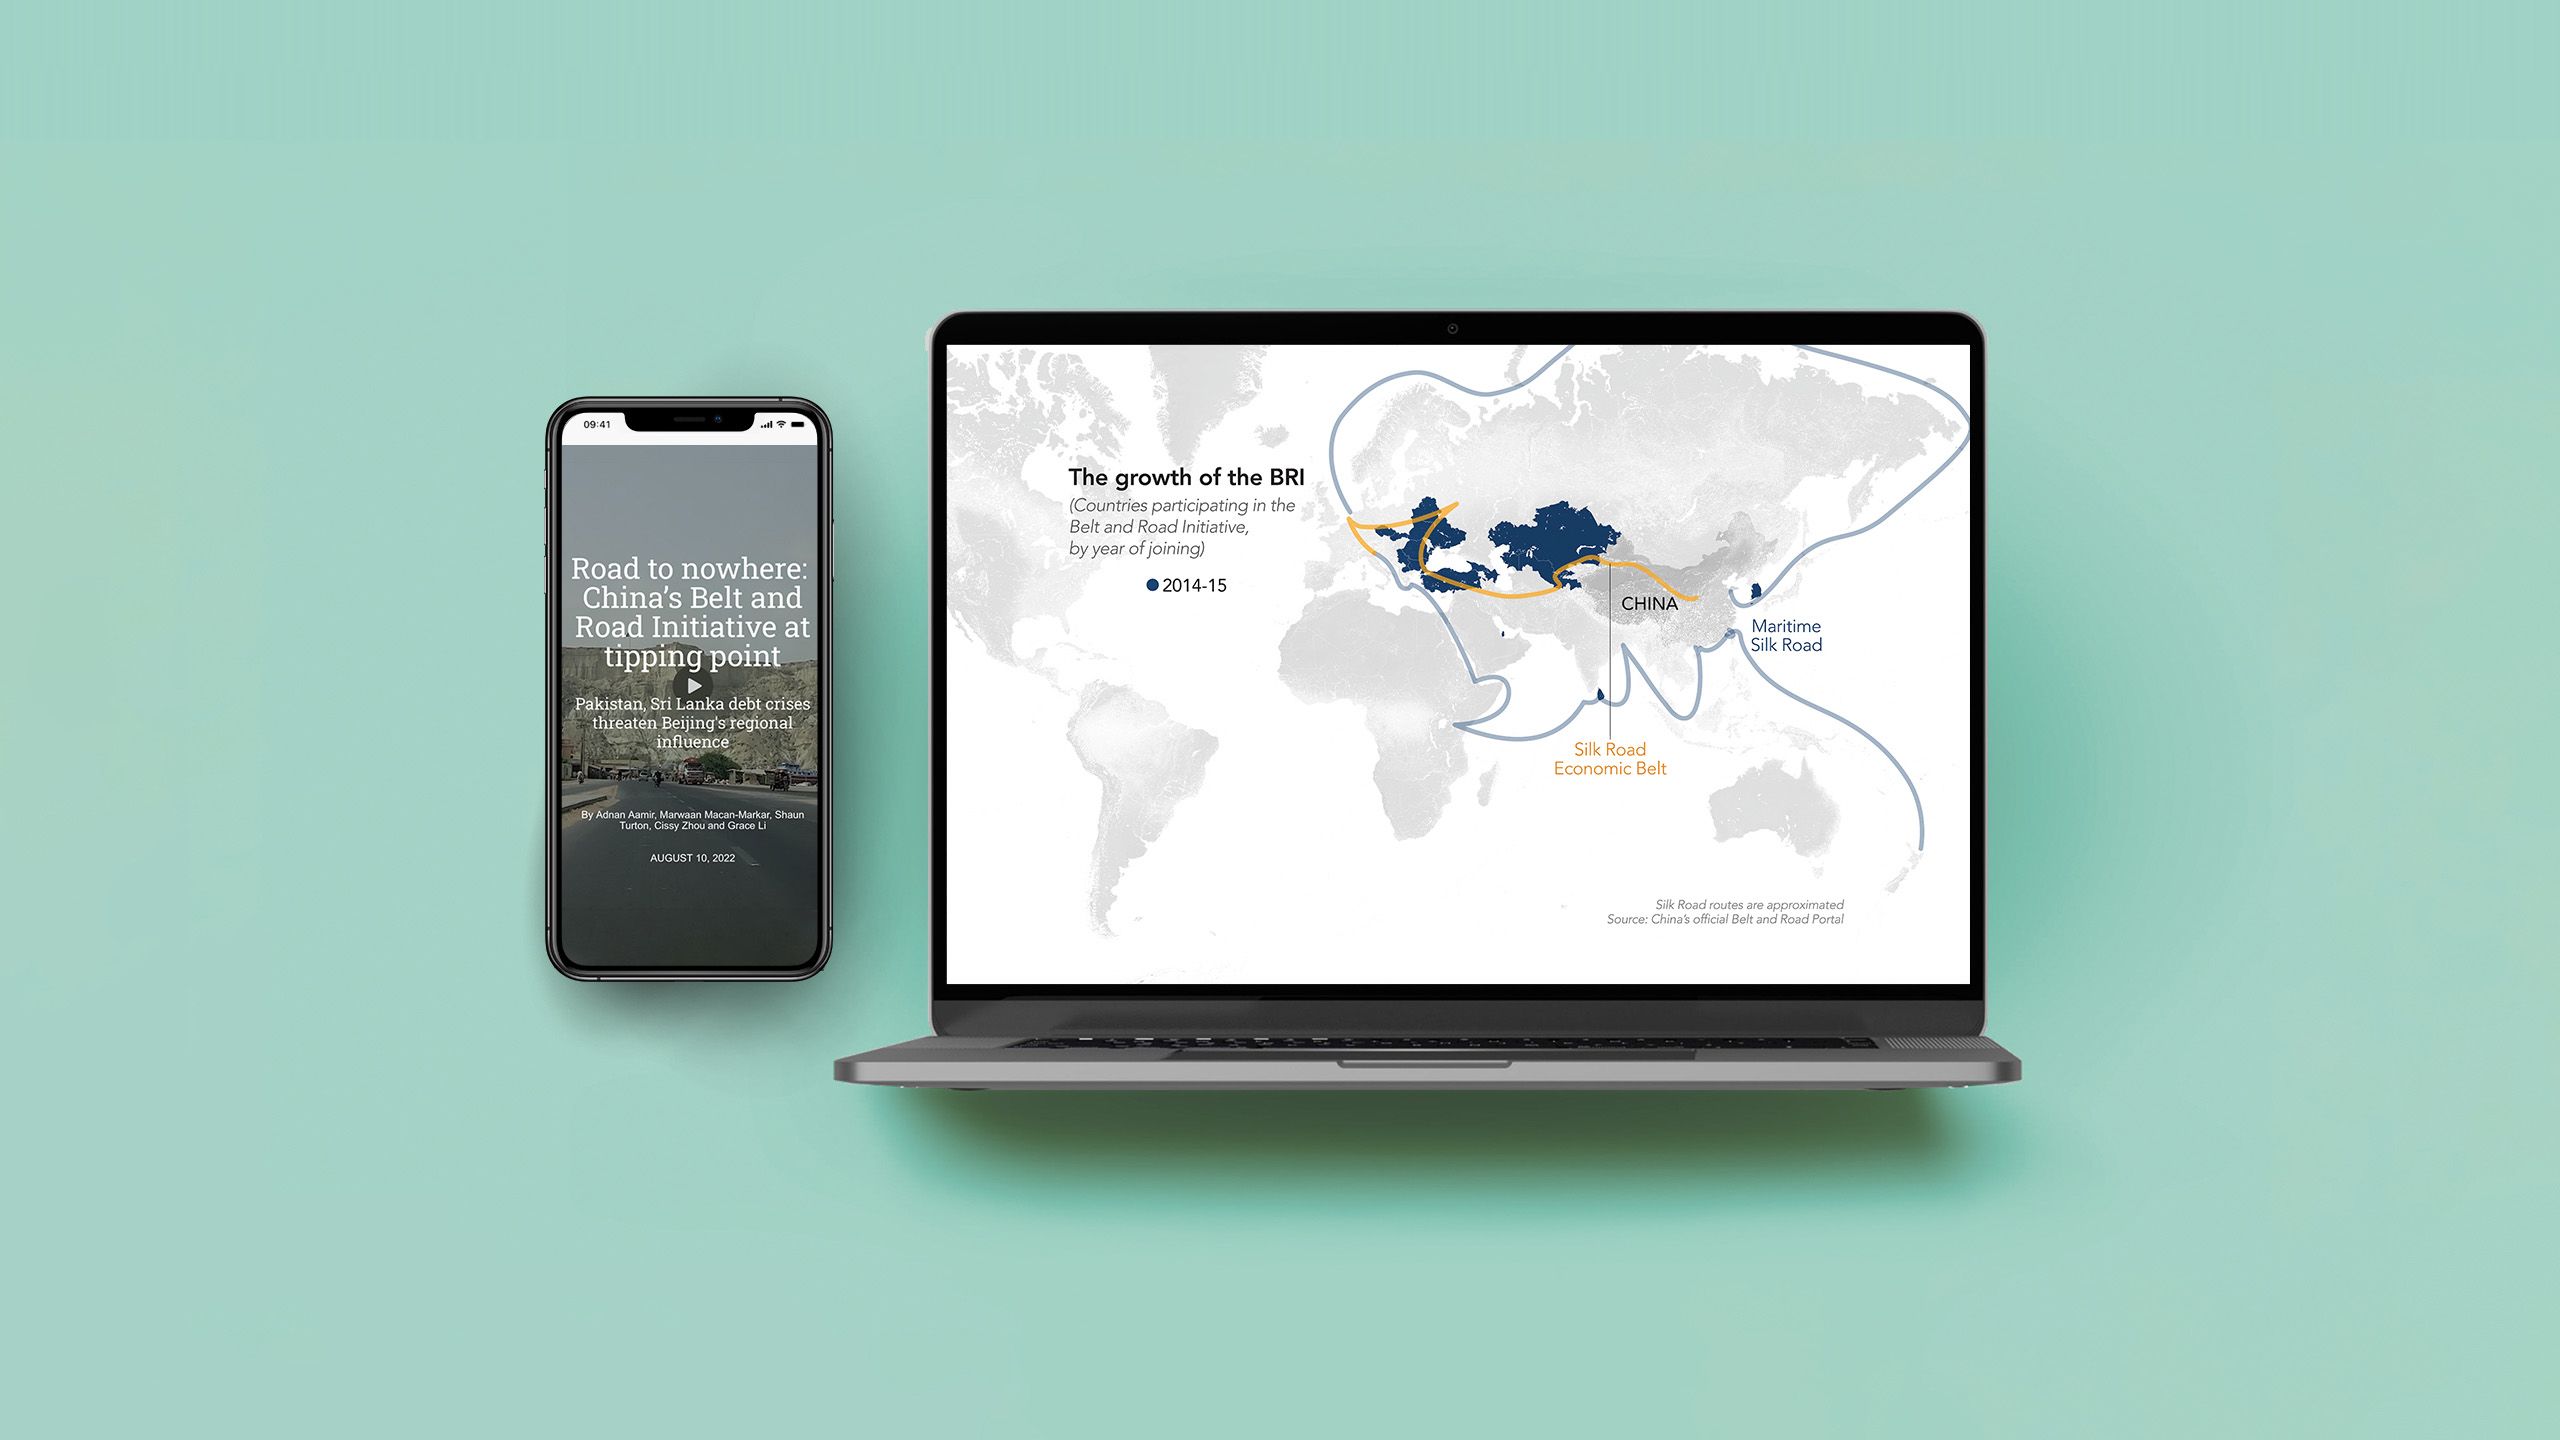
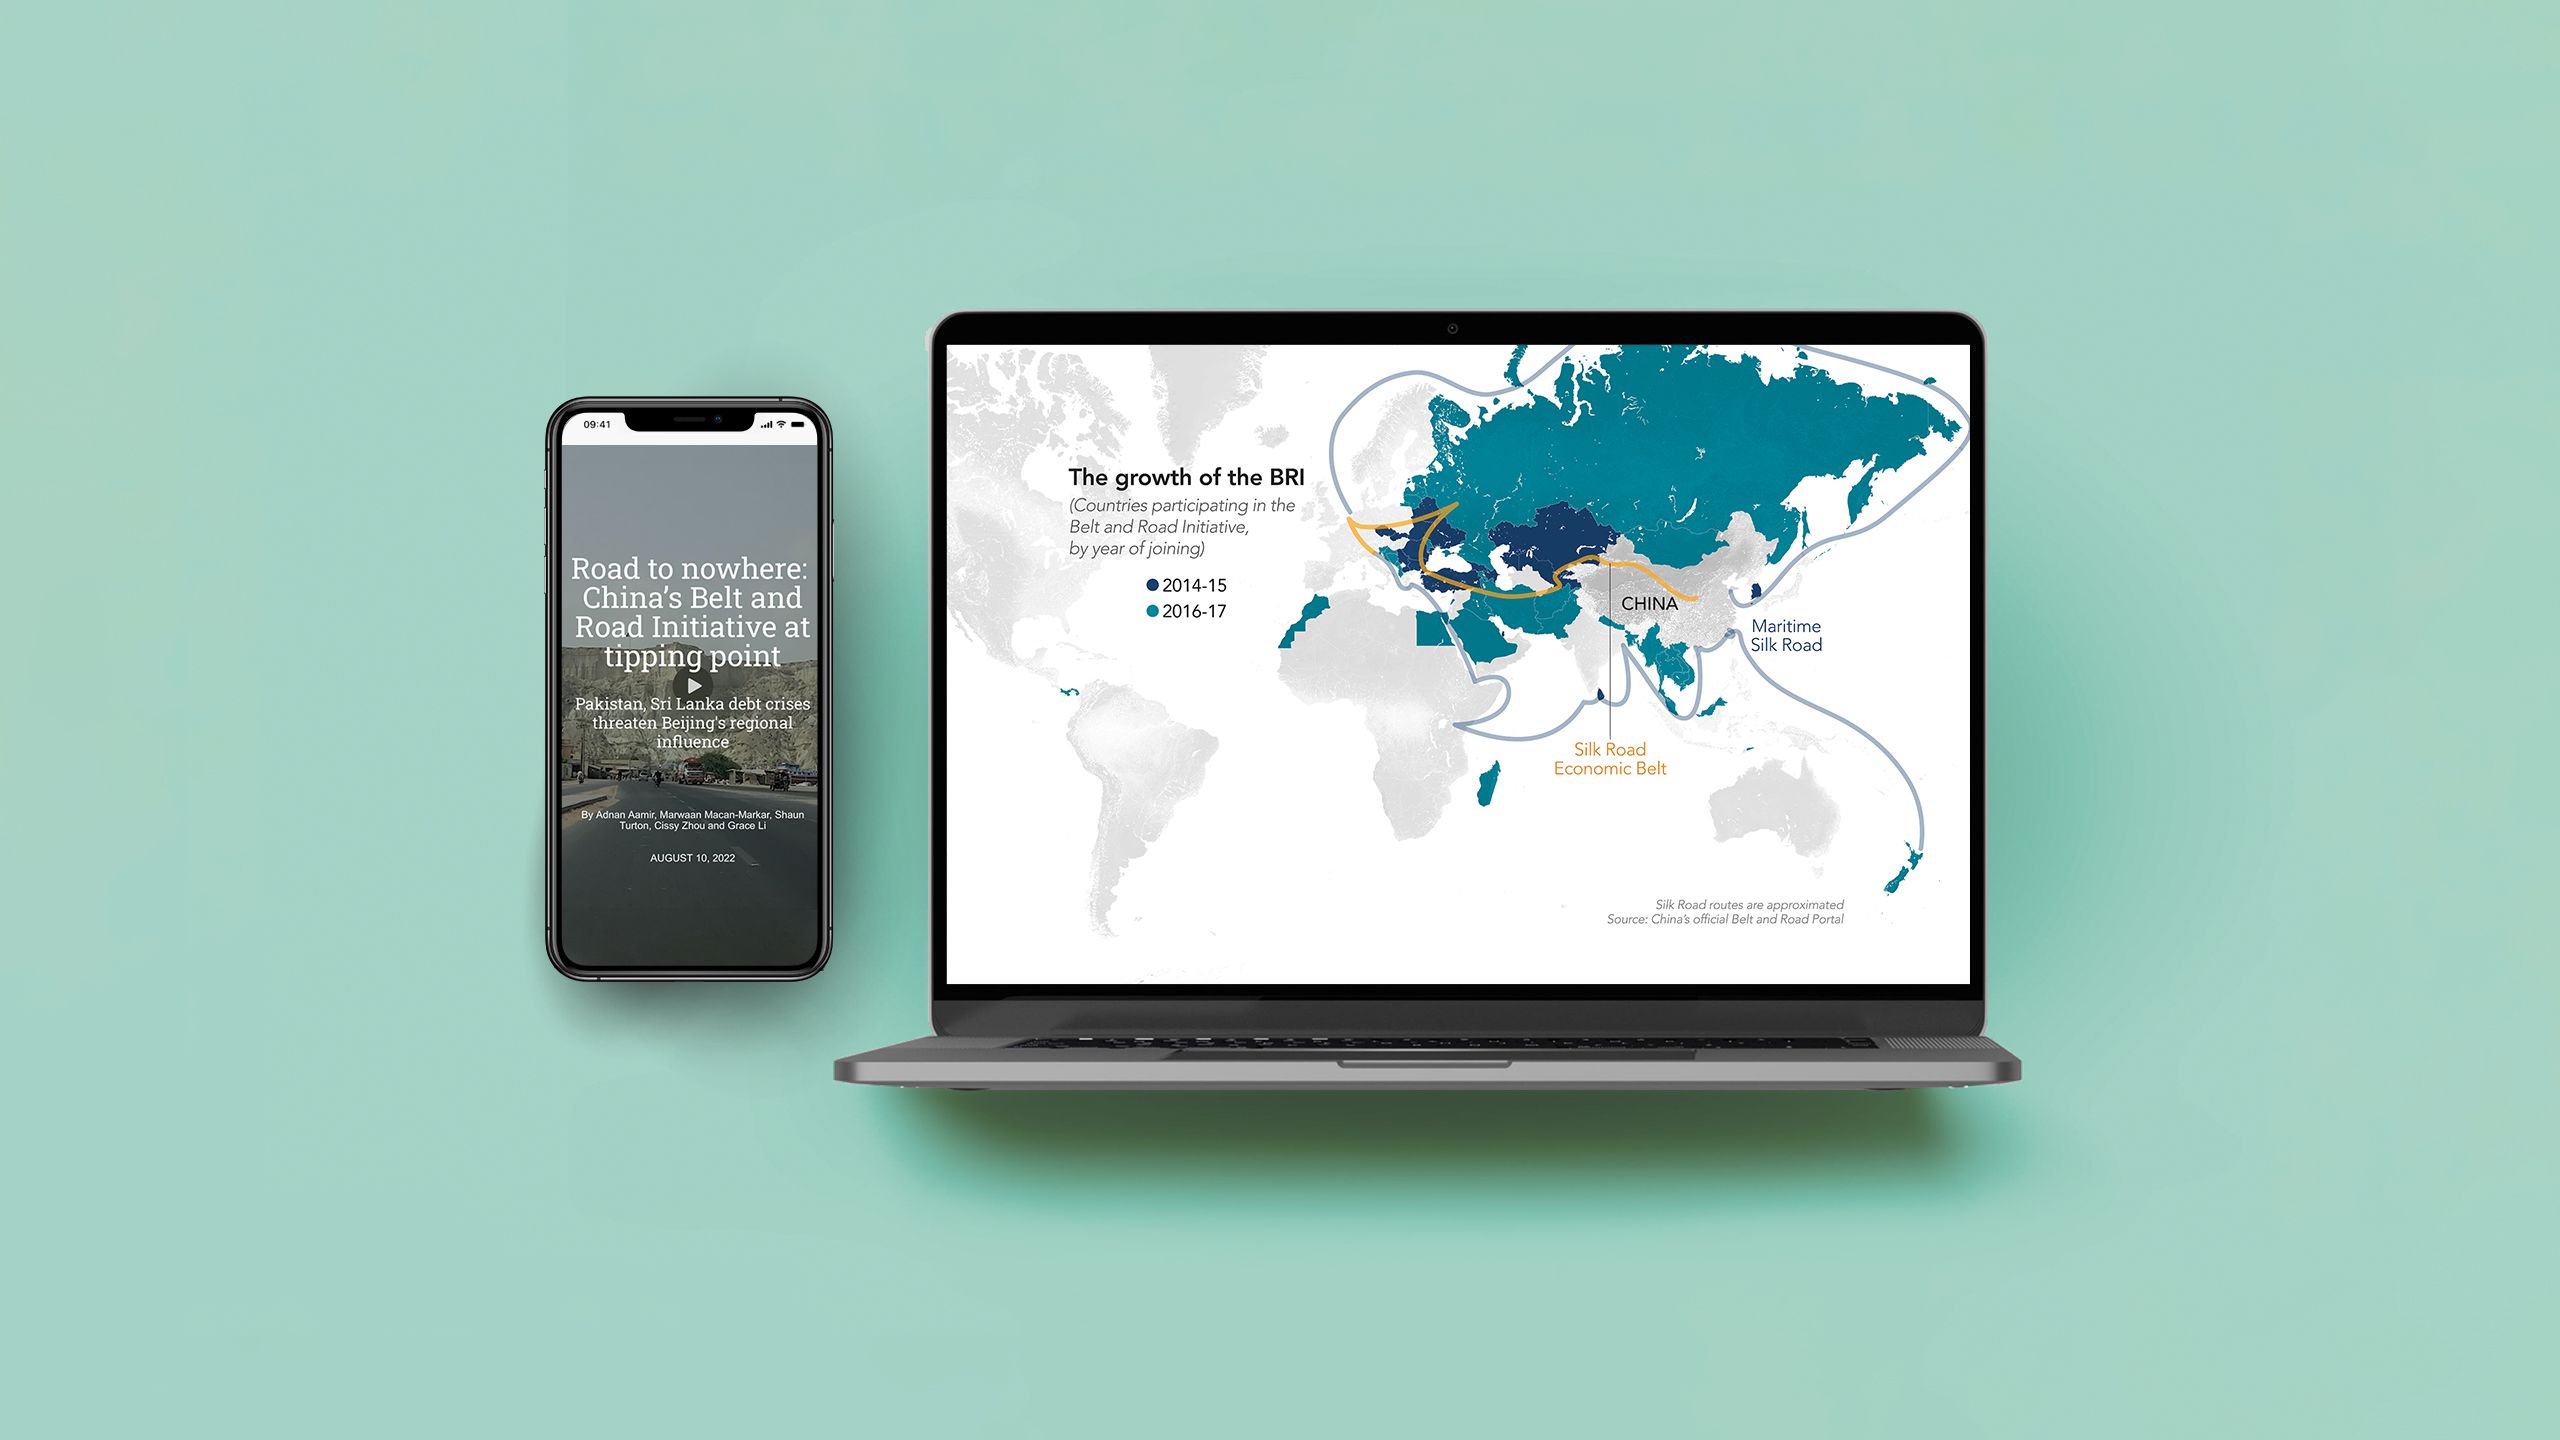
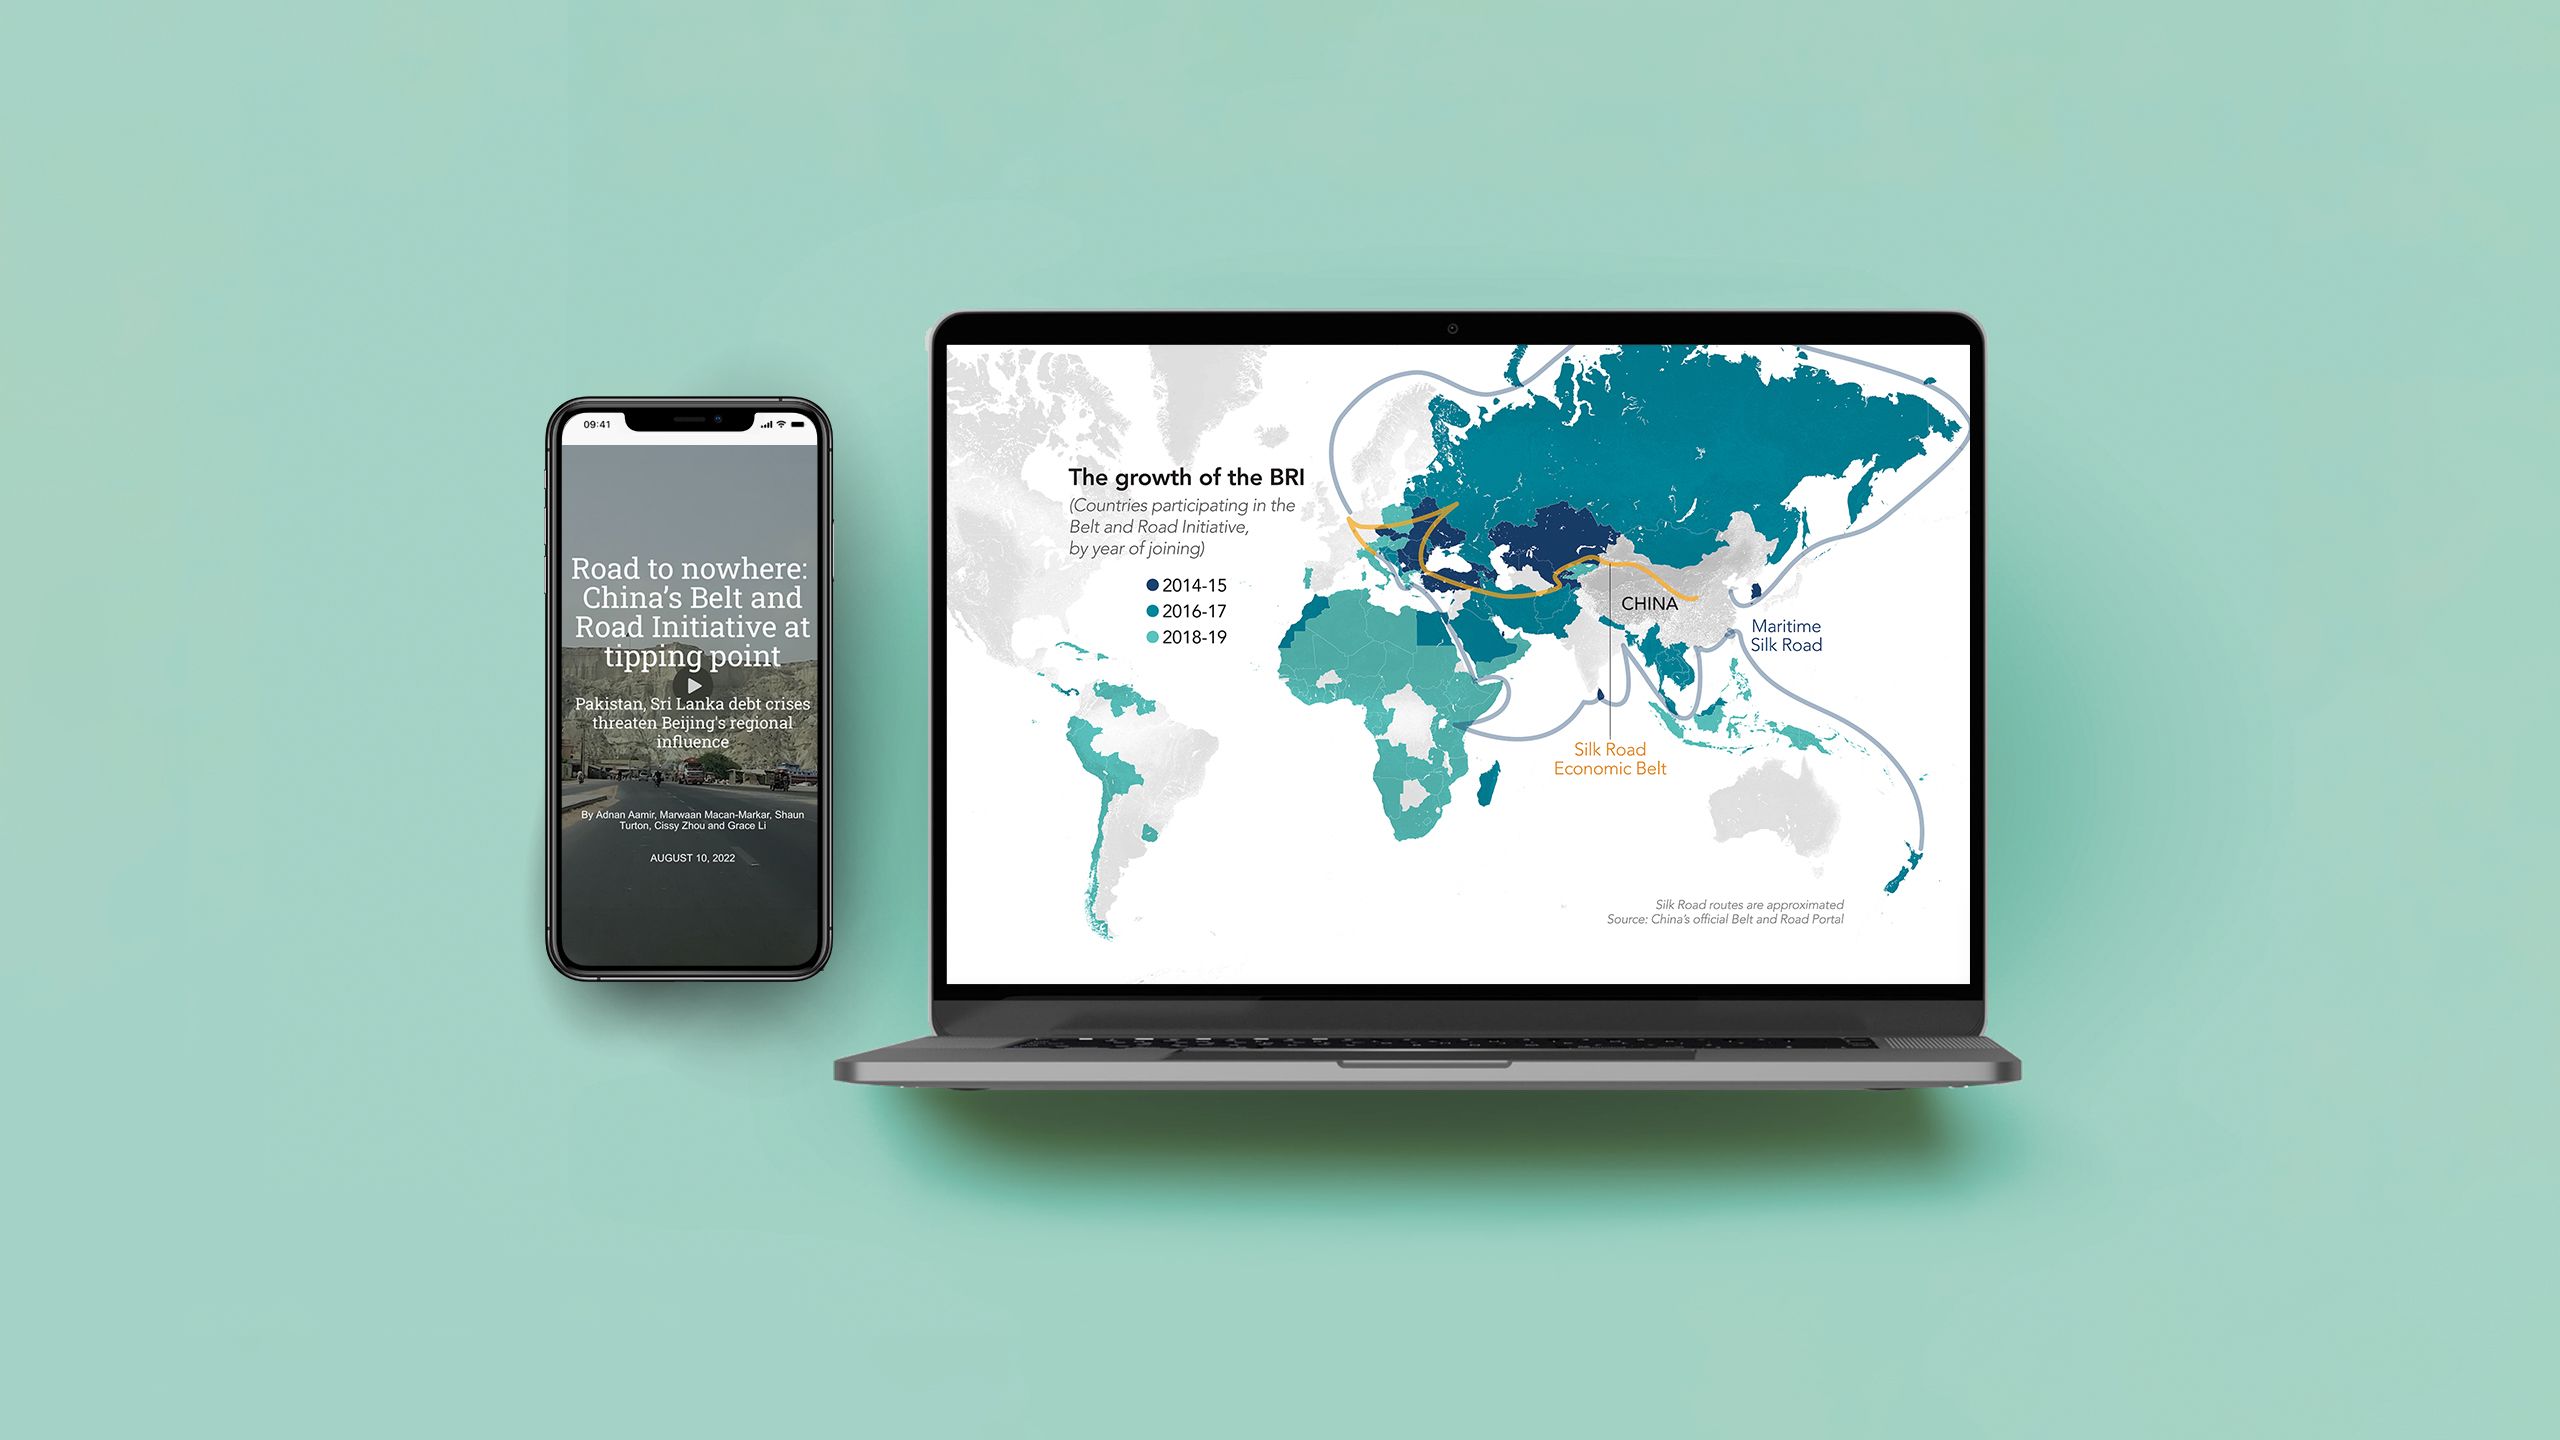
1. Road to nowhere
What it is: an article on China’s Belt and Road Initiative (BRI).
Who created it: Nikkei.
Why we picked this example:
This article from Nikkei does a fantastic job of using a bunch of different media types to convey information throughout. Dynamic data visualisations make the numbers digestible, interactive maps help illustrate the reach of the BRI. Images and videos help break up text, while scrollytelling keeps readers engaged throughout the article.


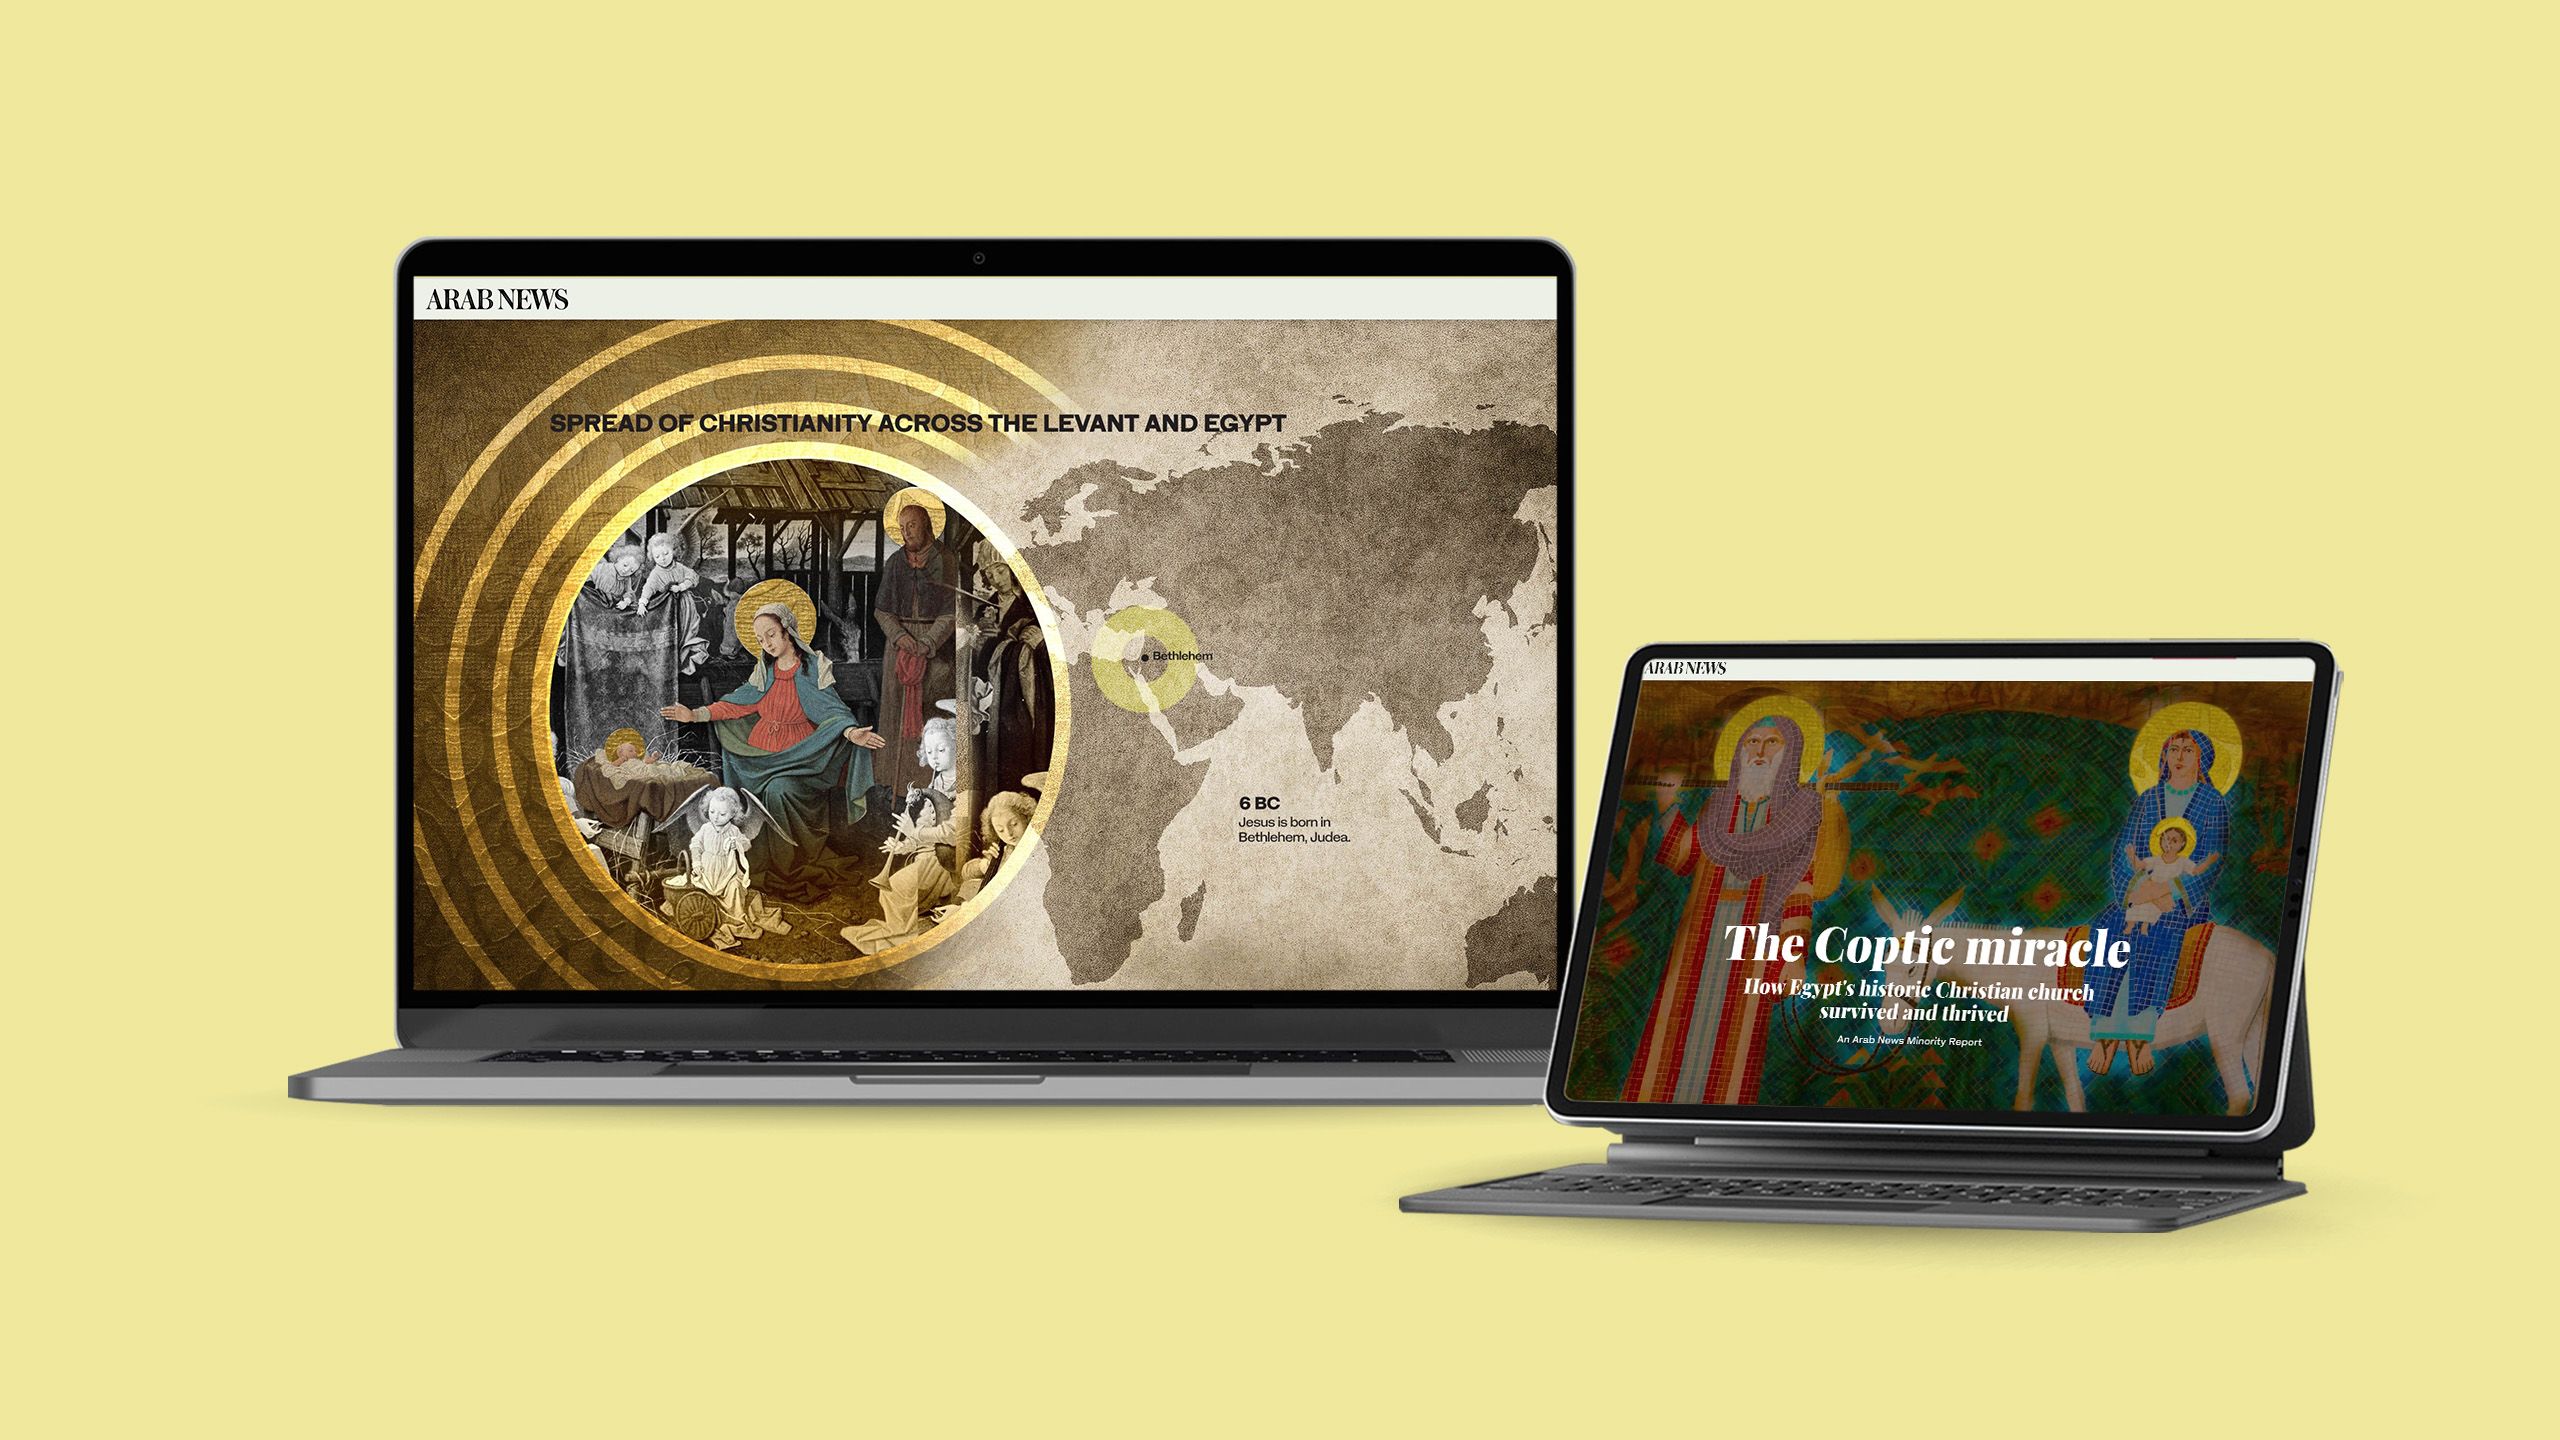
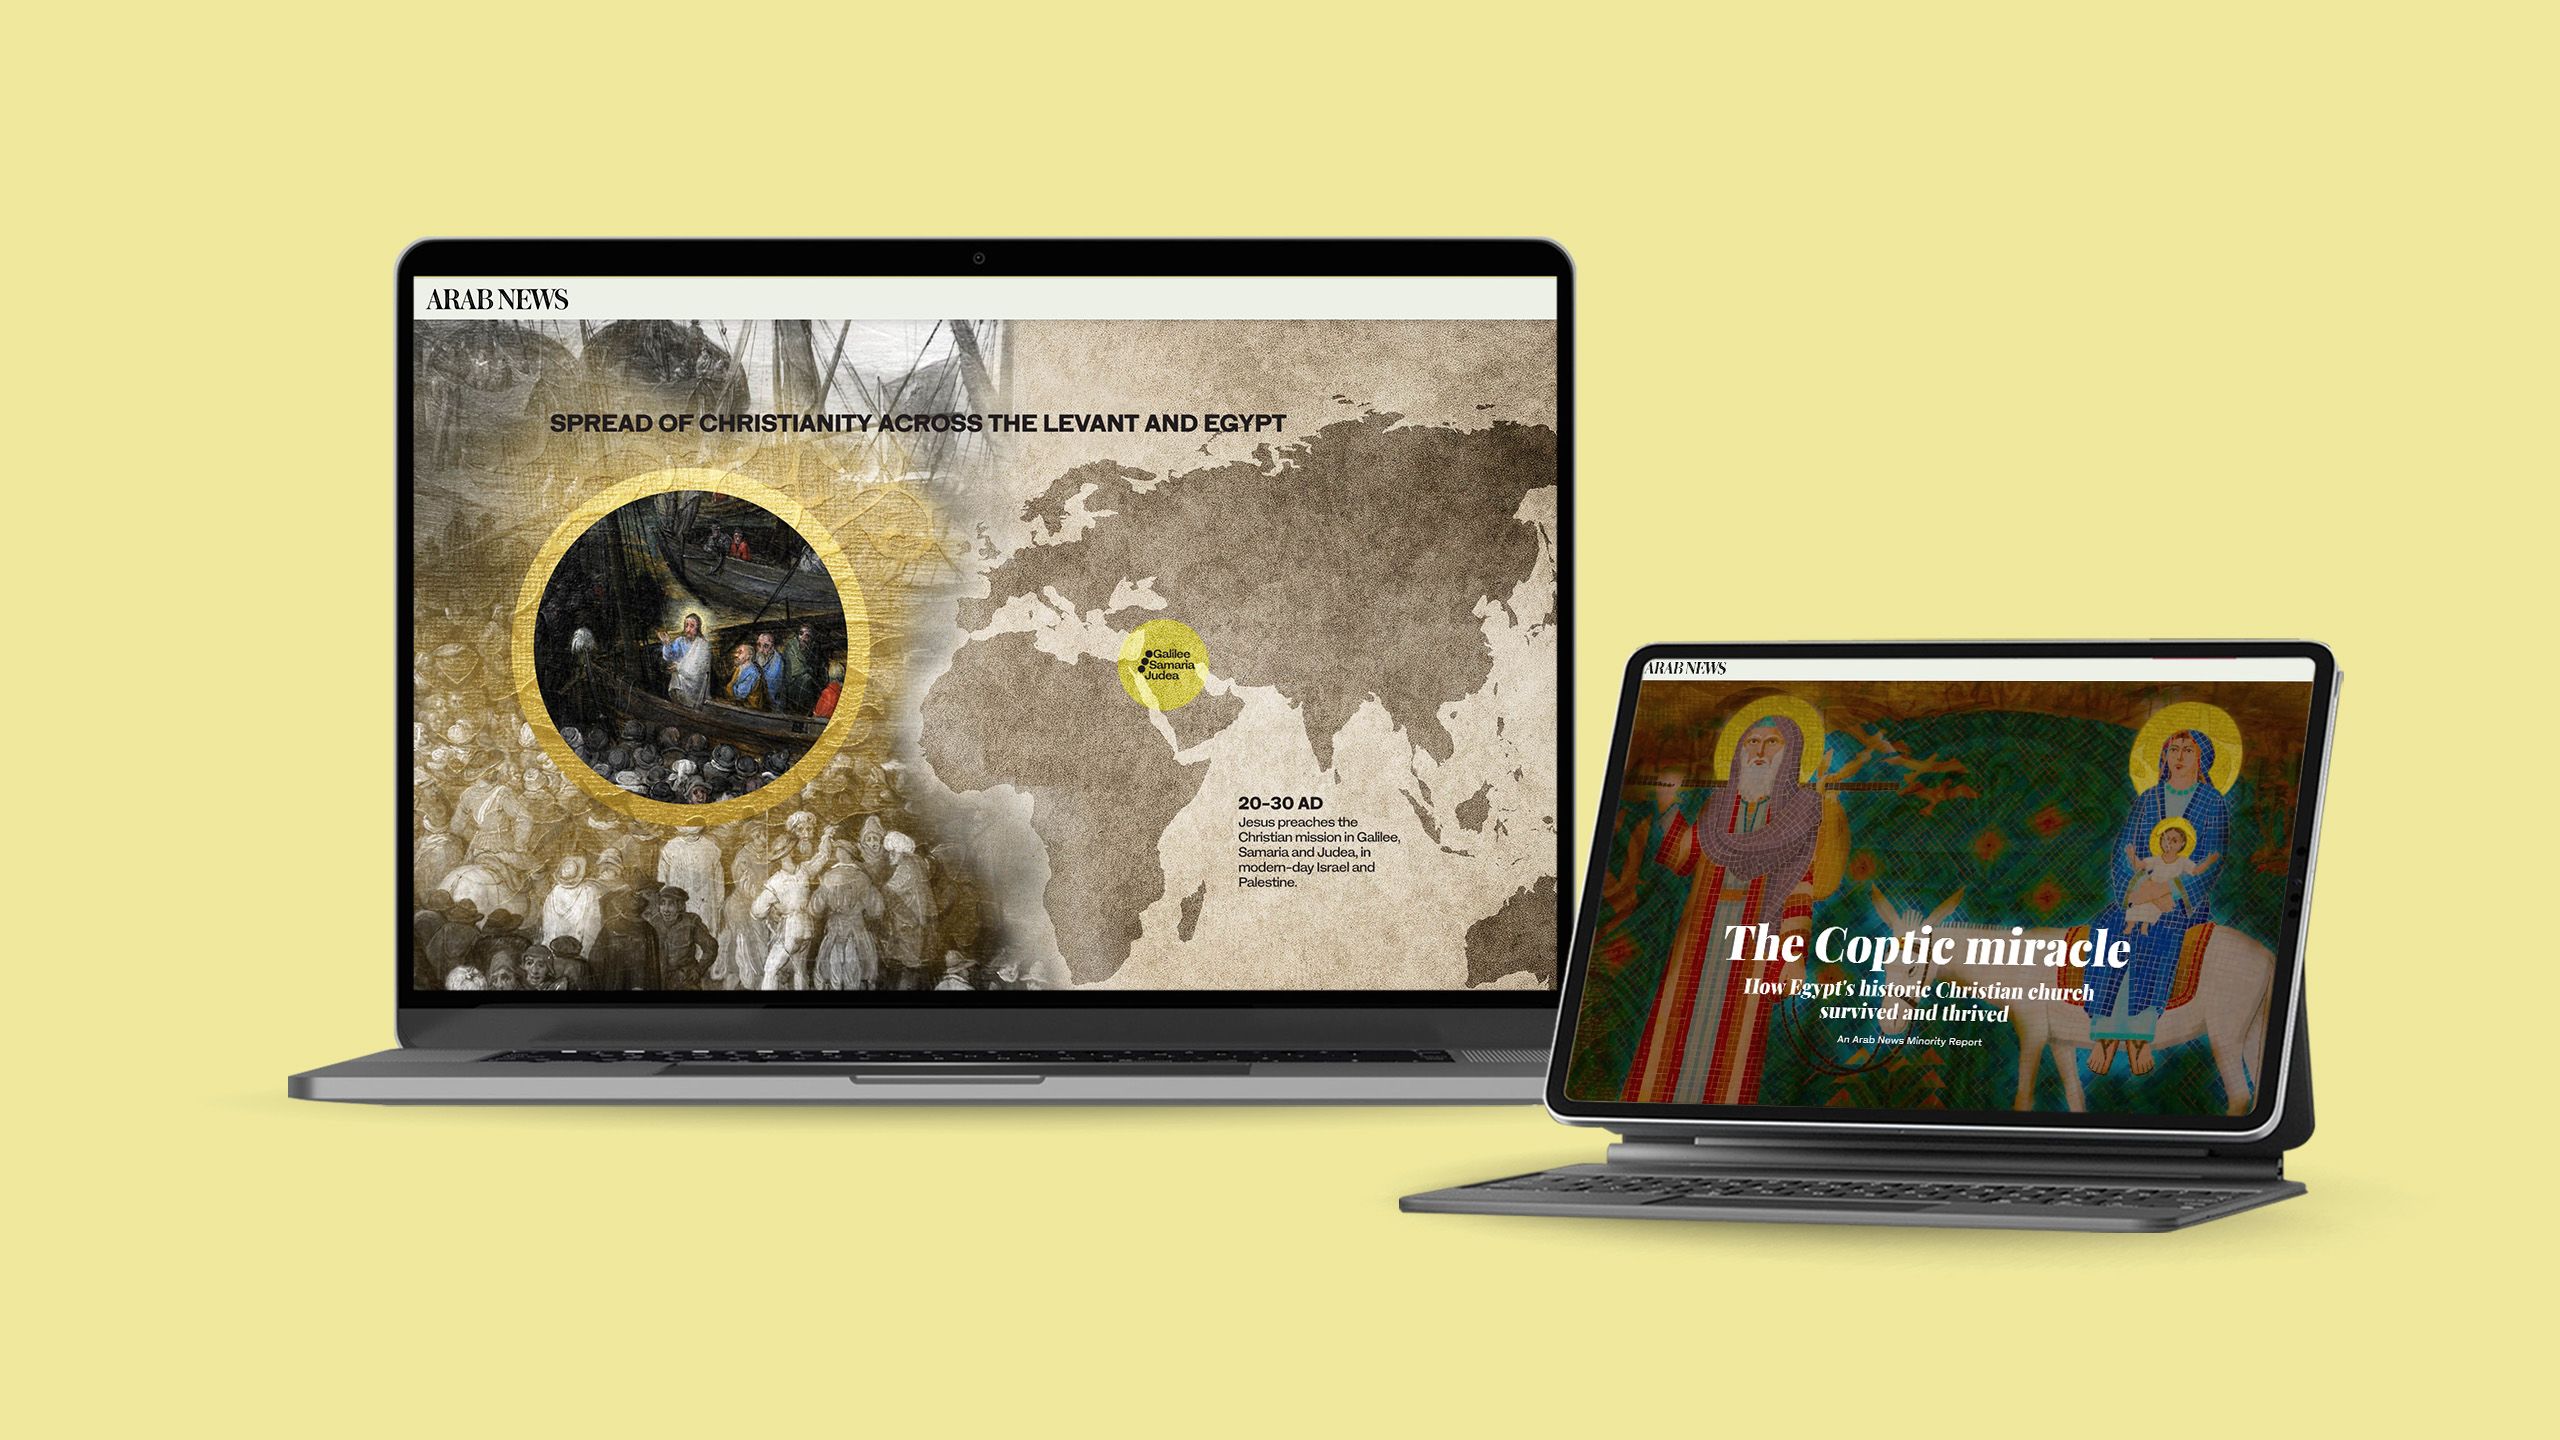
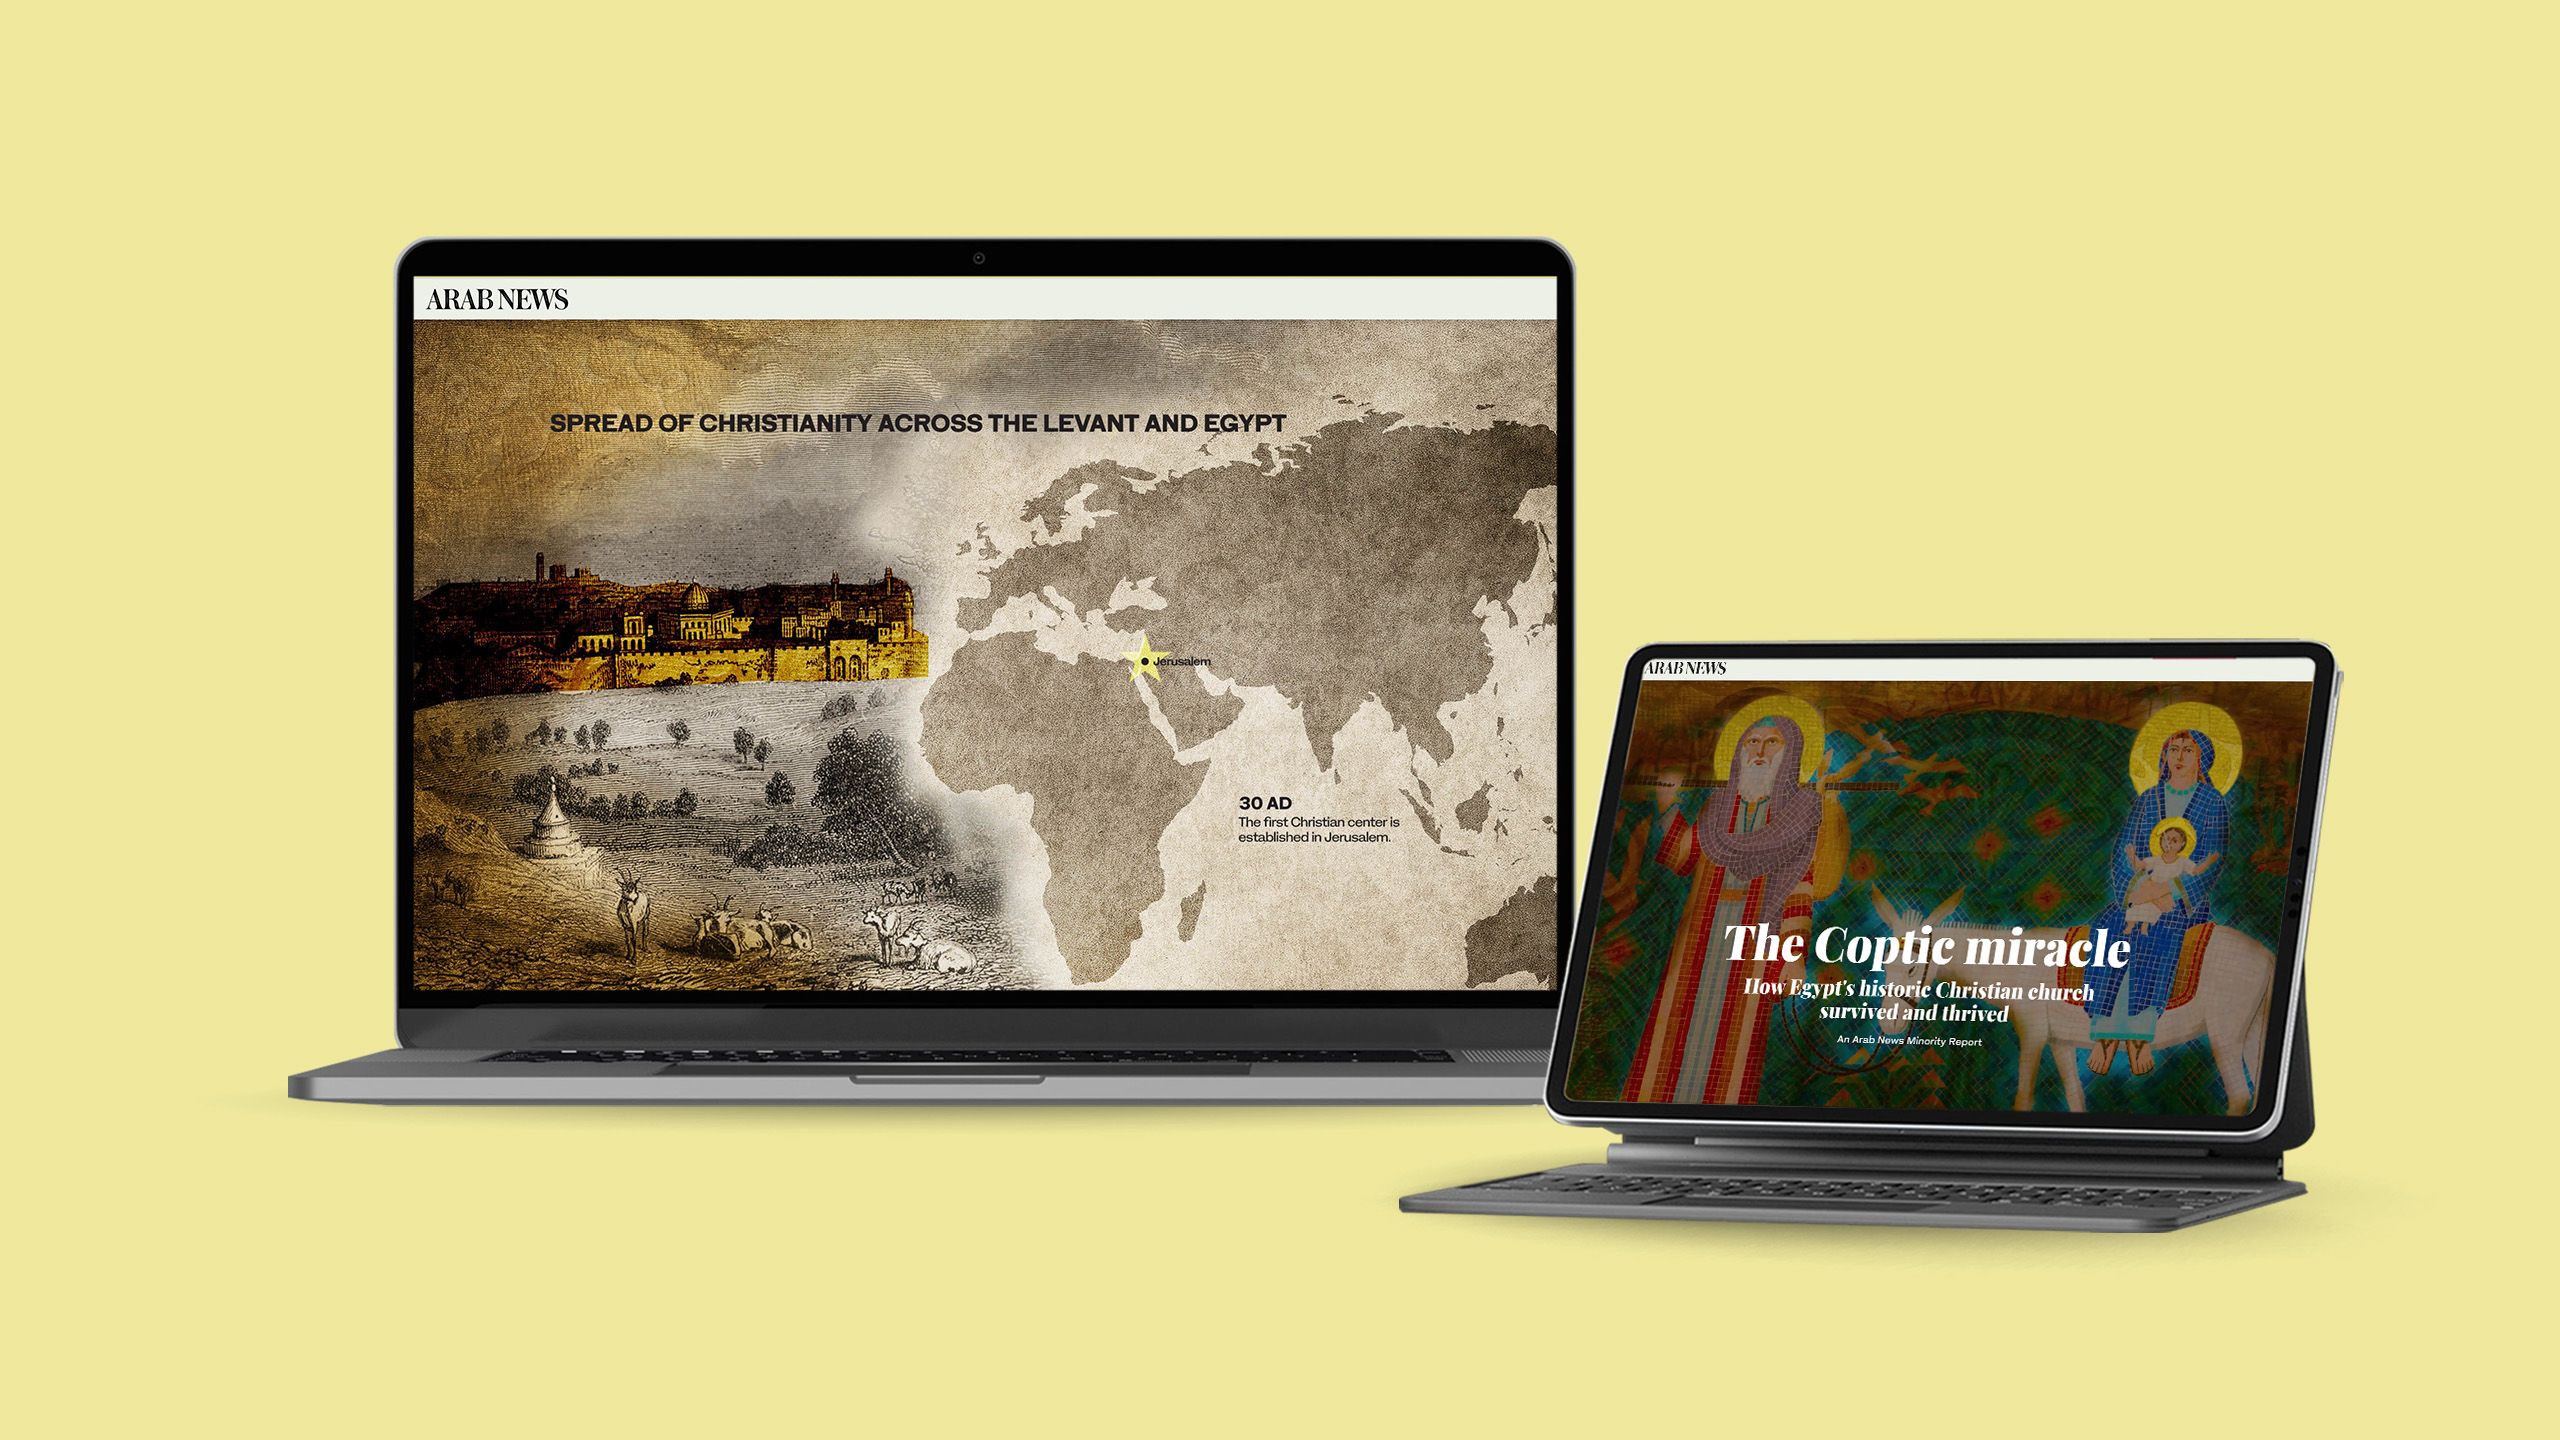
2. The Coptic miracle
What it is: a history of the development of Coptic Christianity.
Who created it: Arab News.
Why we picked this example:
We love how this piece uses compelling, dynamic images to add a visual break for readers, but what really stands out here are the interactive maps and timeline. They’re engaging, using scrollytelling to trigger additional information, but they’re also incredibly well-designed. The visual “brand” of the maps perfectly compliments the aesthetic of the rest of the page.


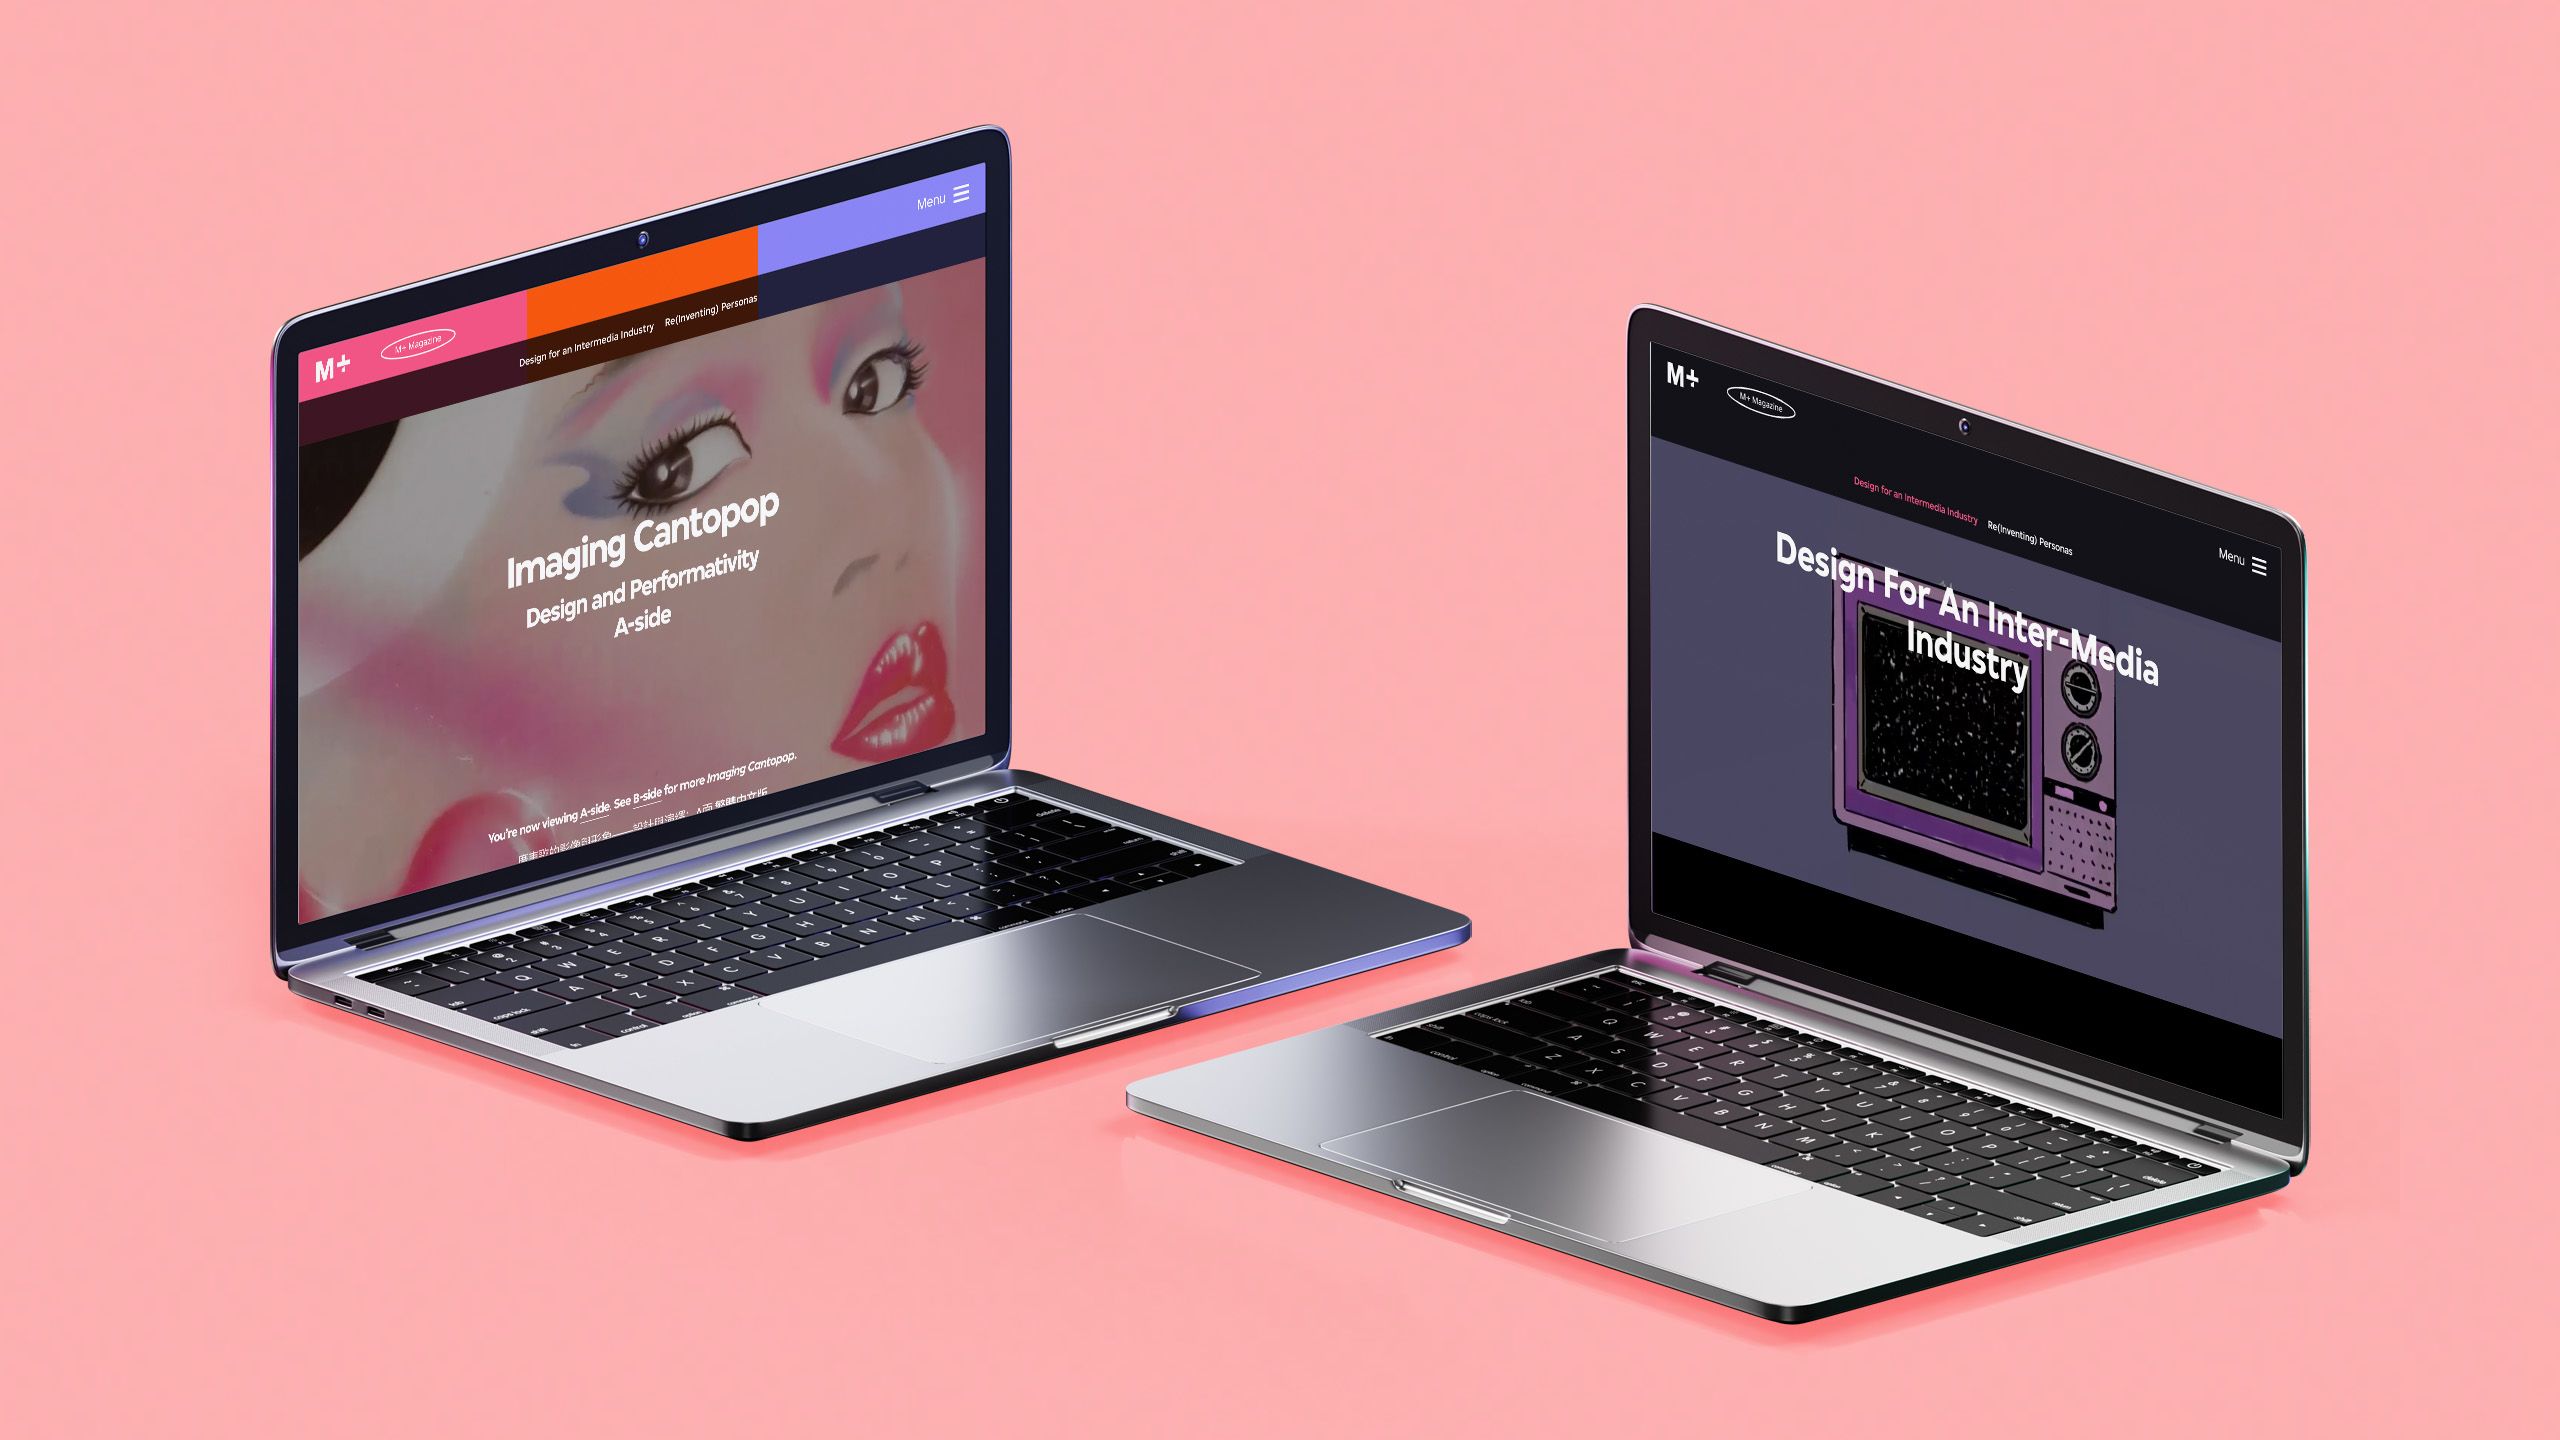
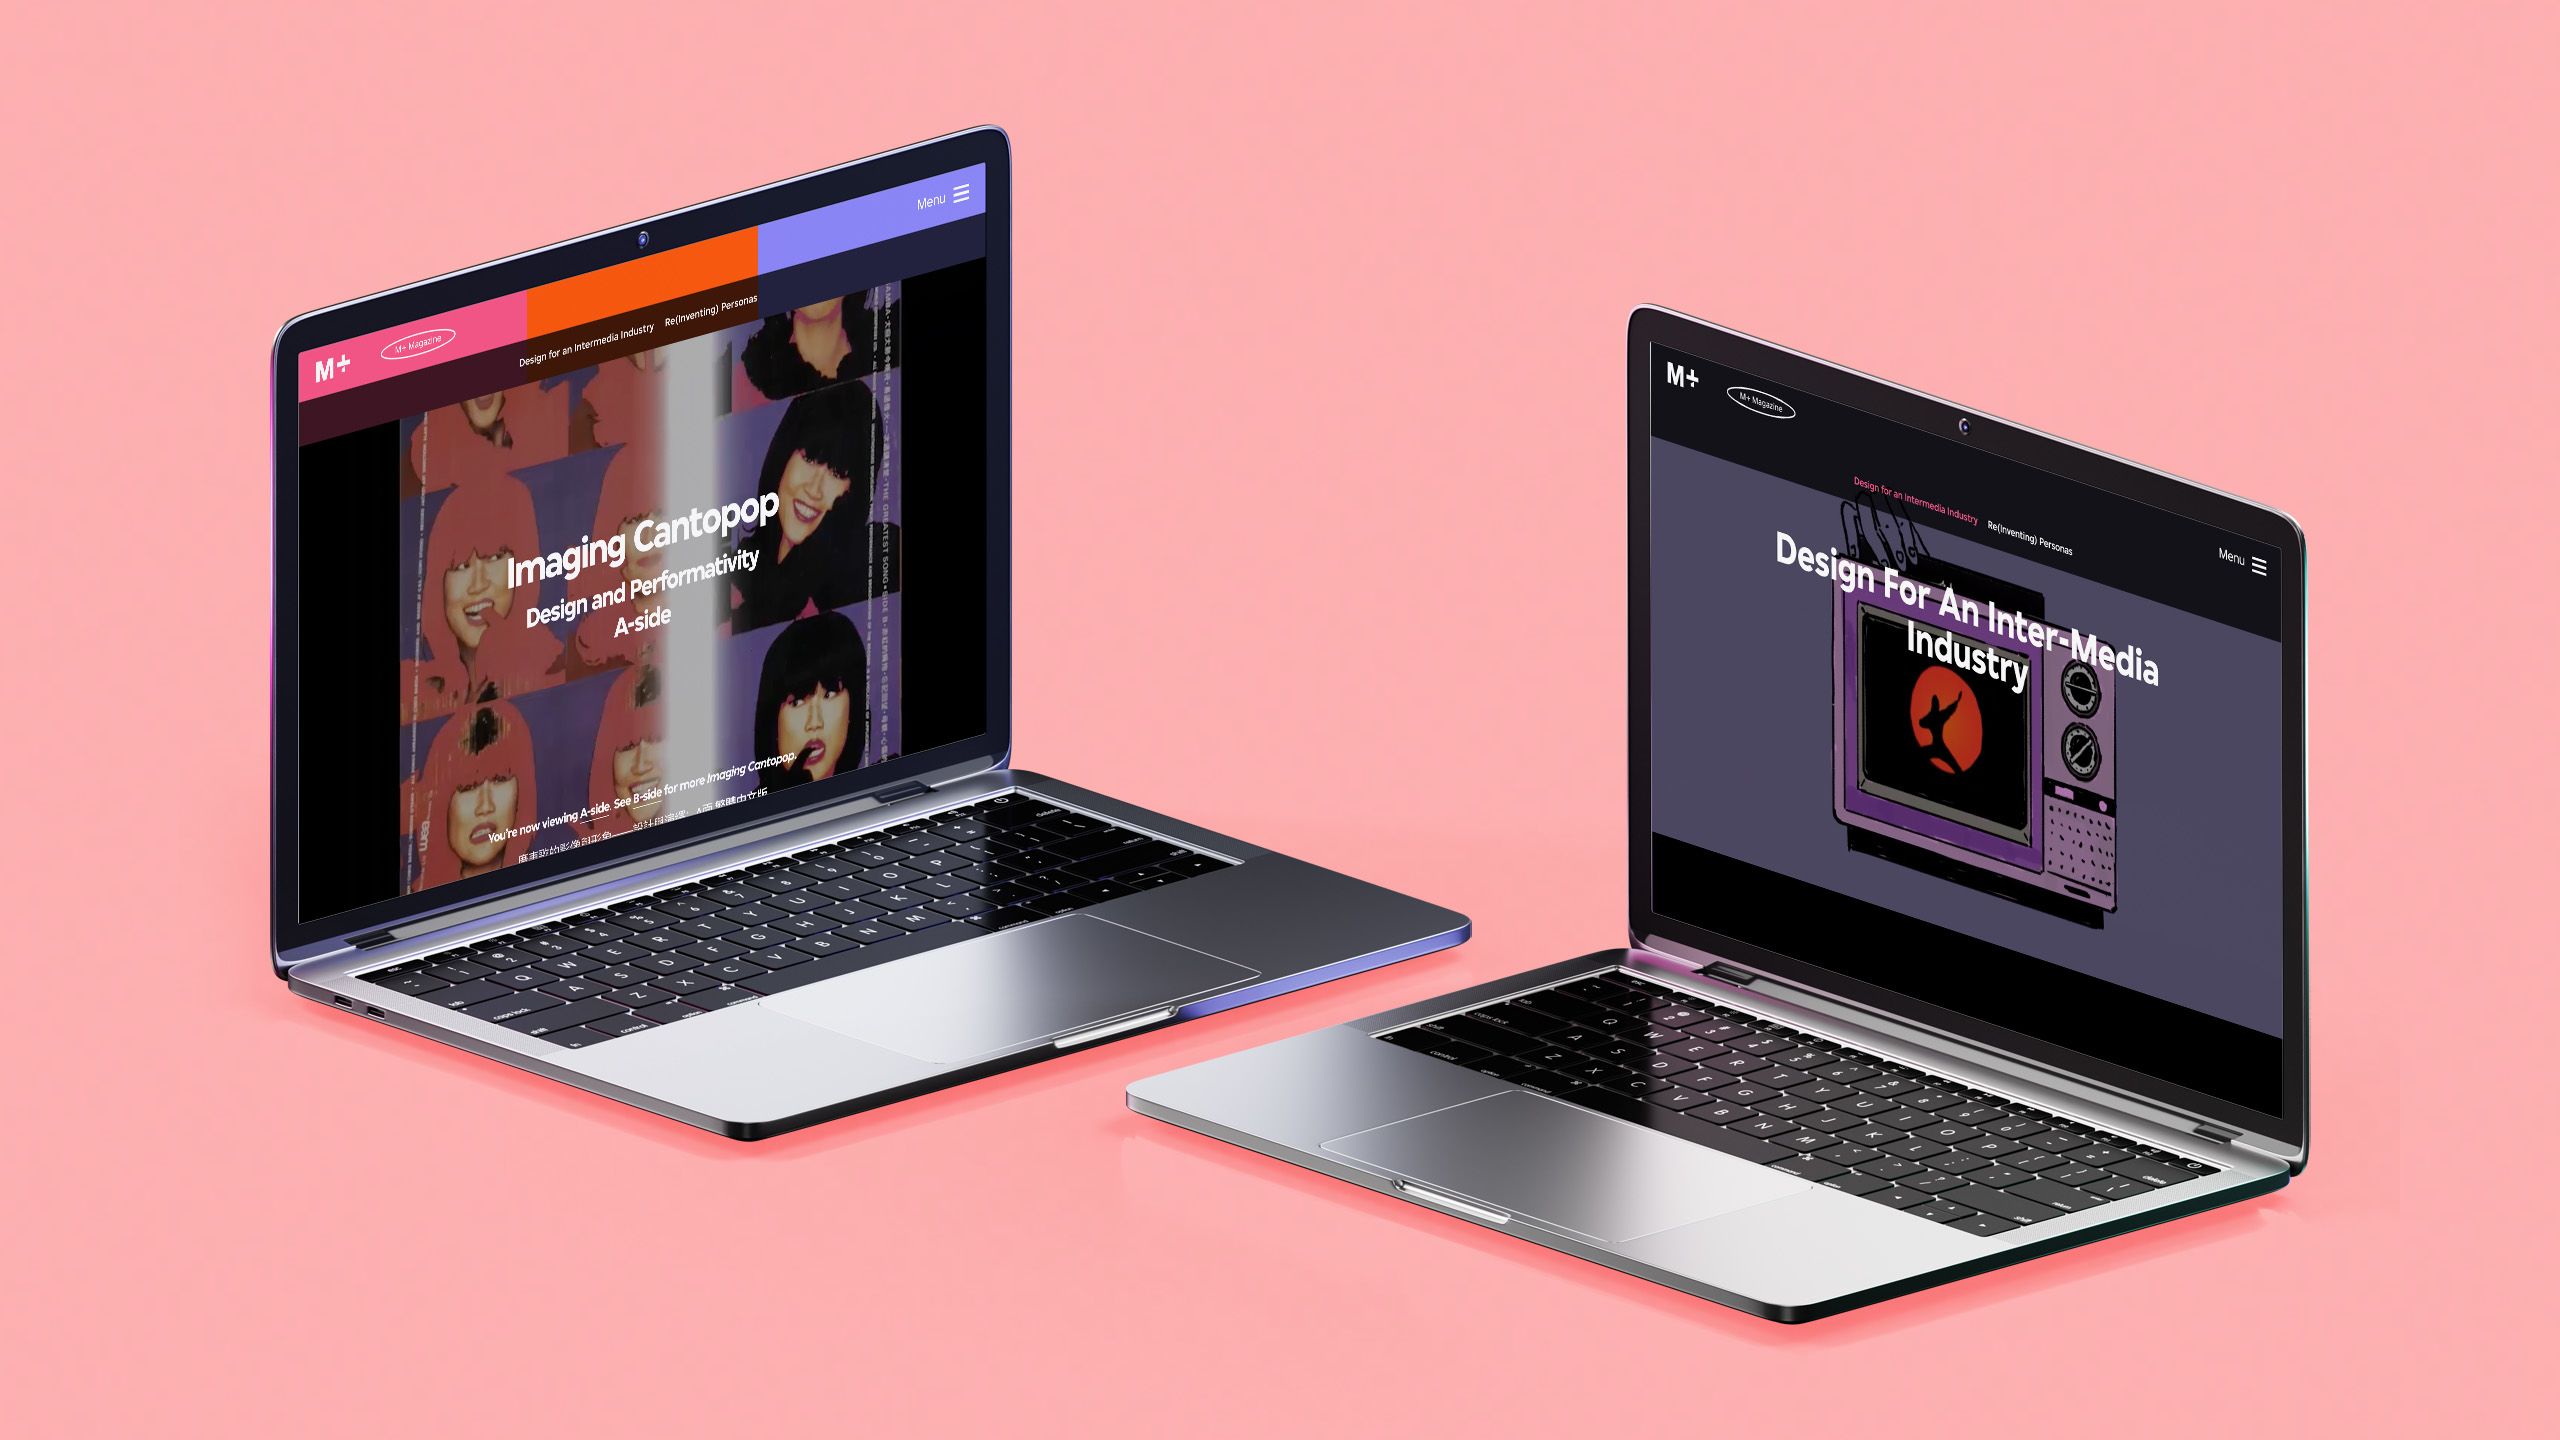
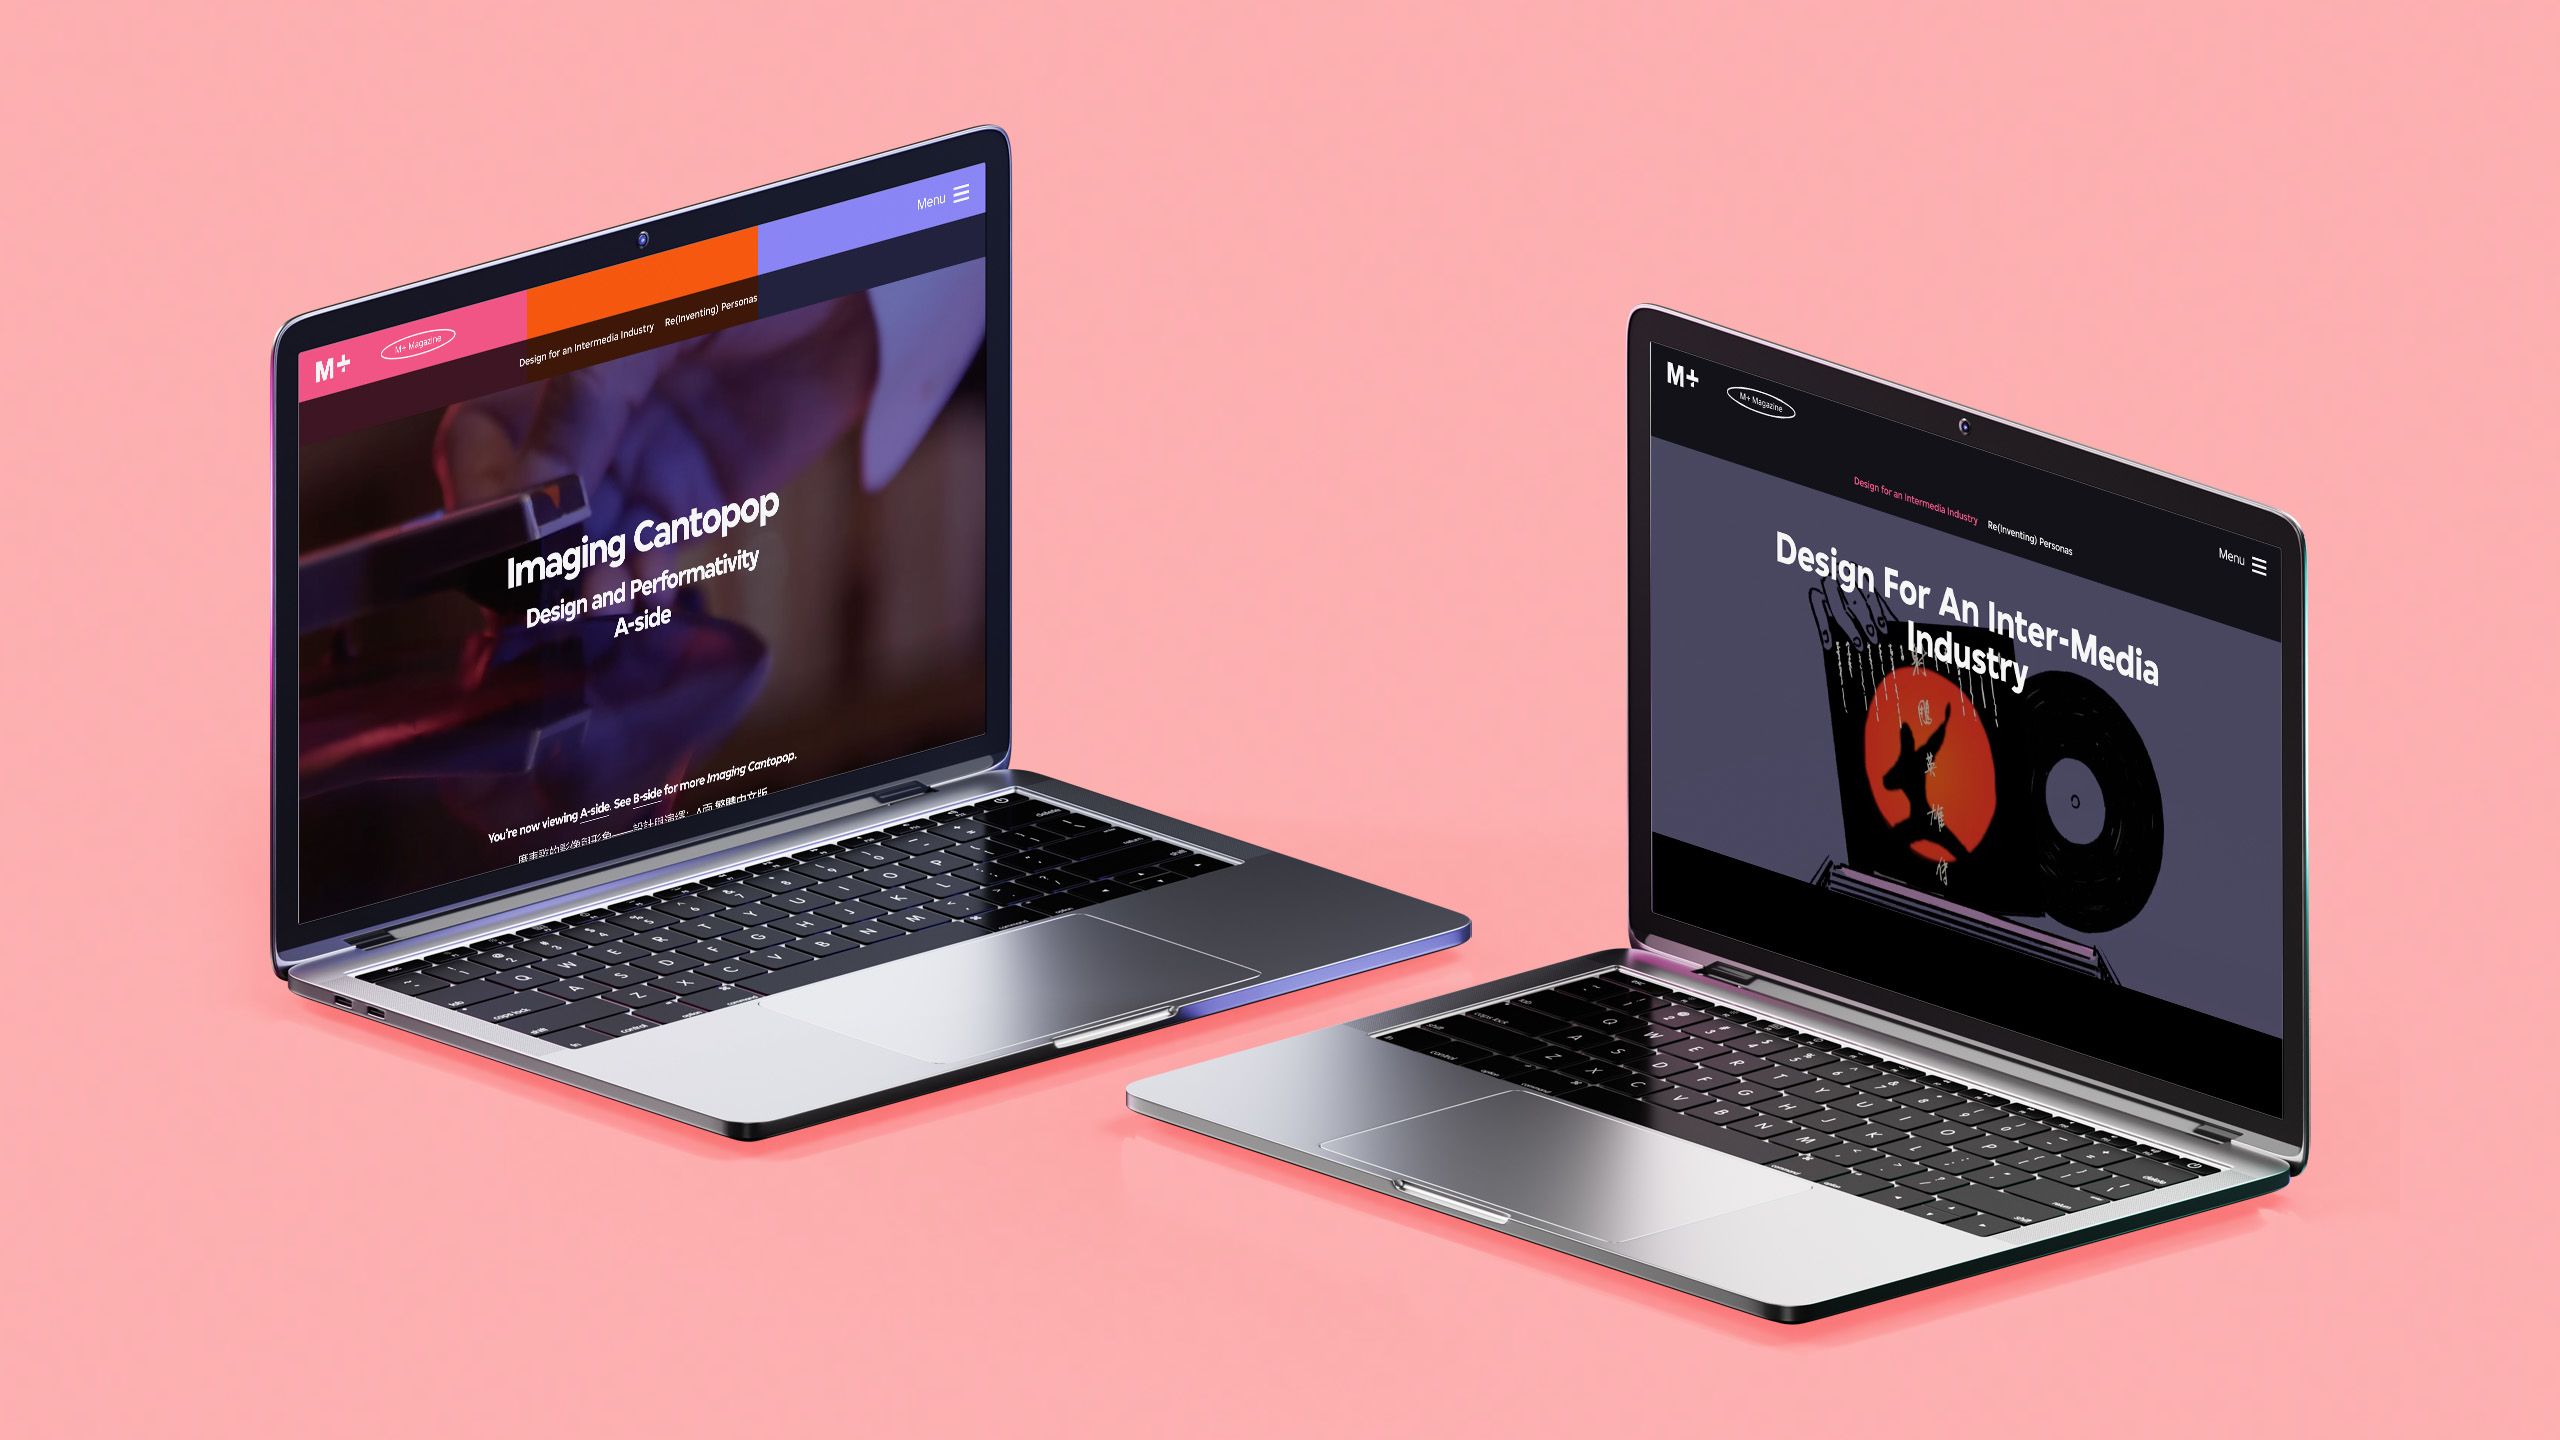
3. Imaging Cantopop
What it is: an article series on the graphic design strategies behind Cantopop’s rise.
Who created it: M+ Magazine.
Why we picked this example:
This series from M+, a retrospective on the use of graphic design in the Cantopop musical movement, is all about the visuals — literally. The article leans into that by letting the imagery really lead the way, from photographs to GIFs and animation, while adding a combination of text and video that offers context as users scroll.


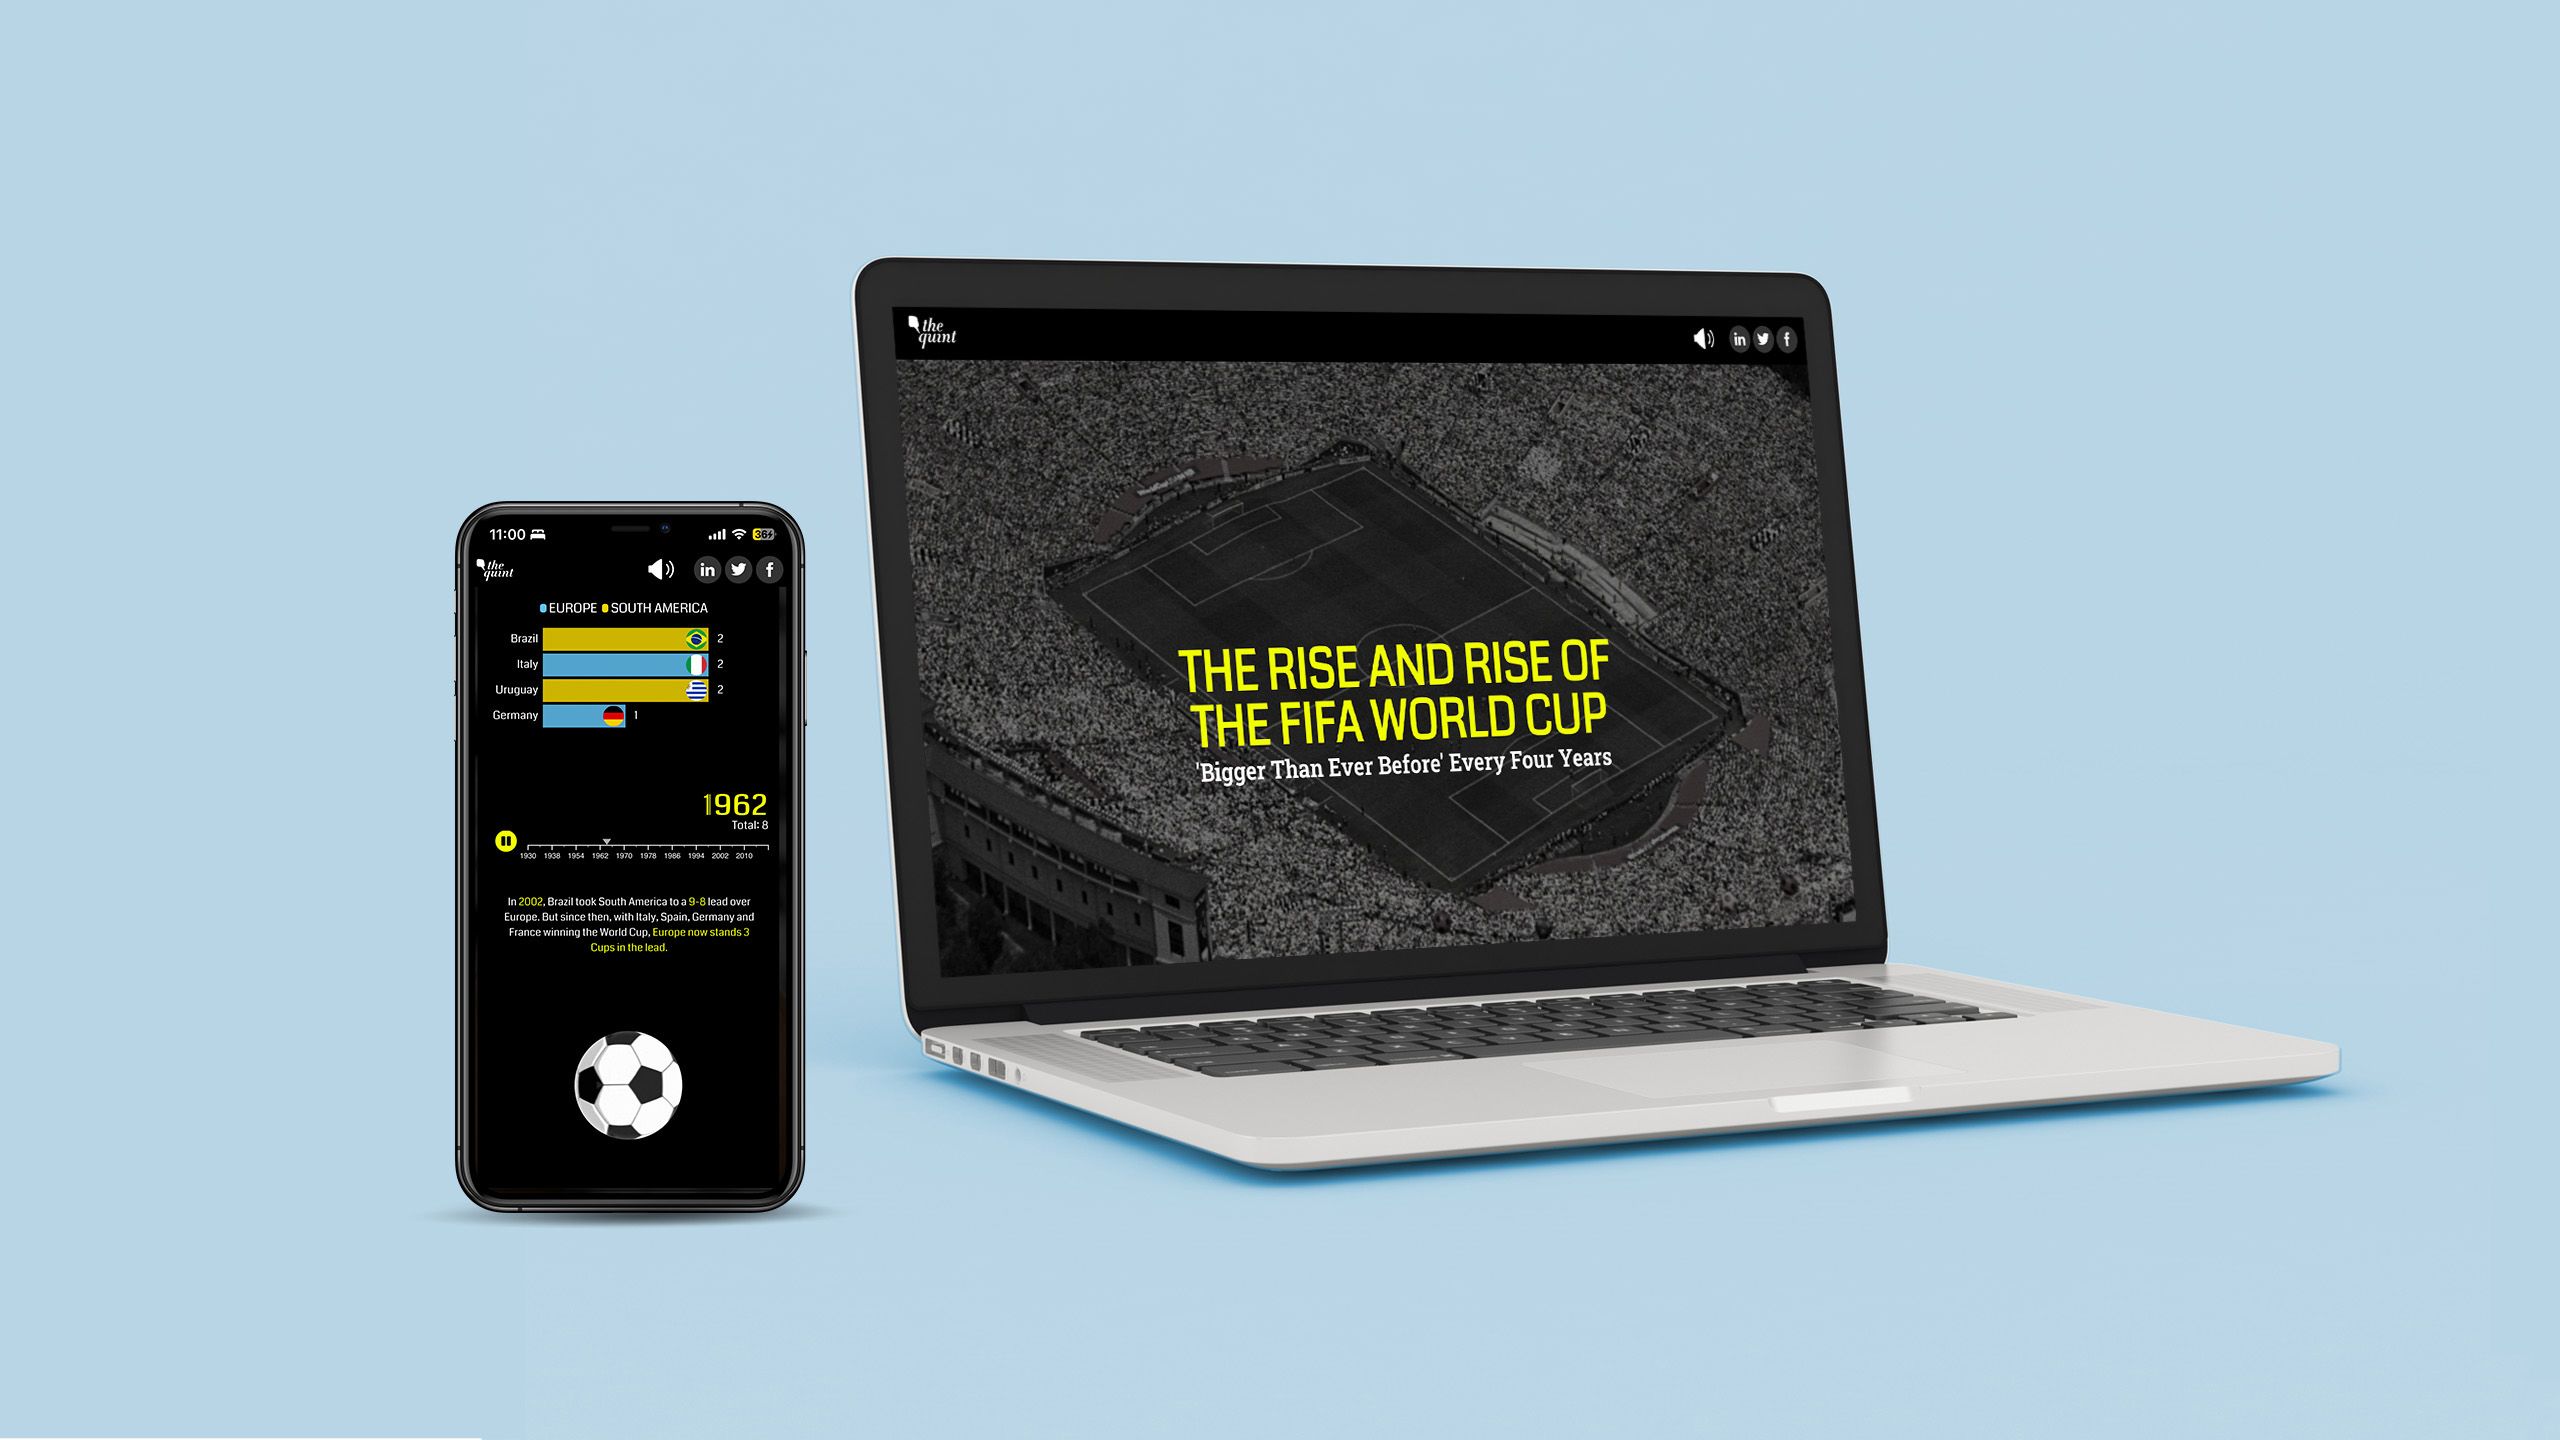
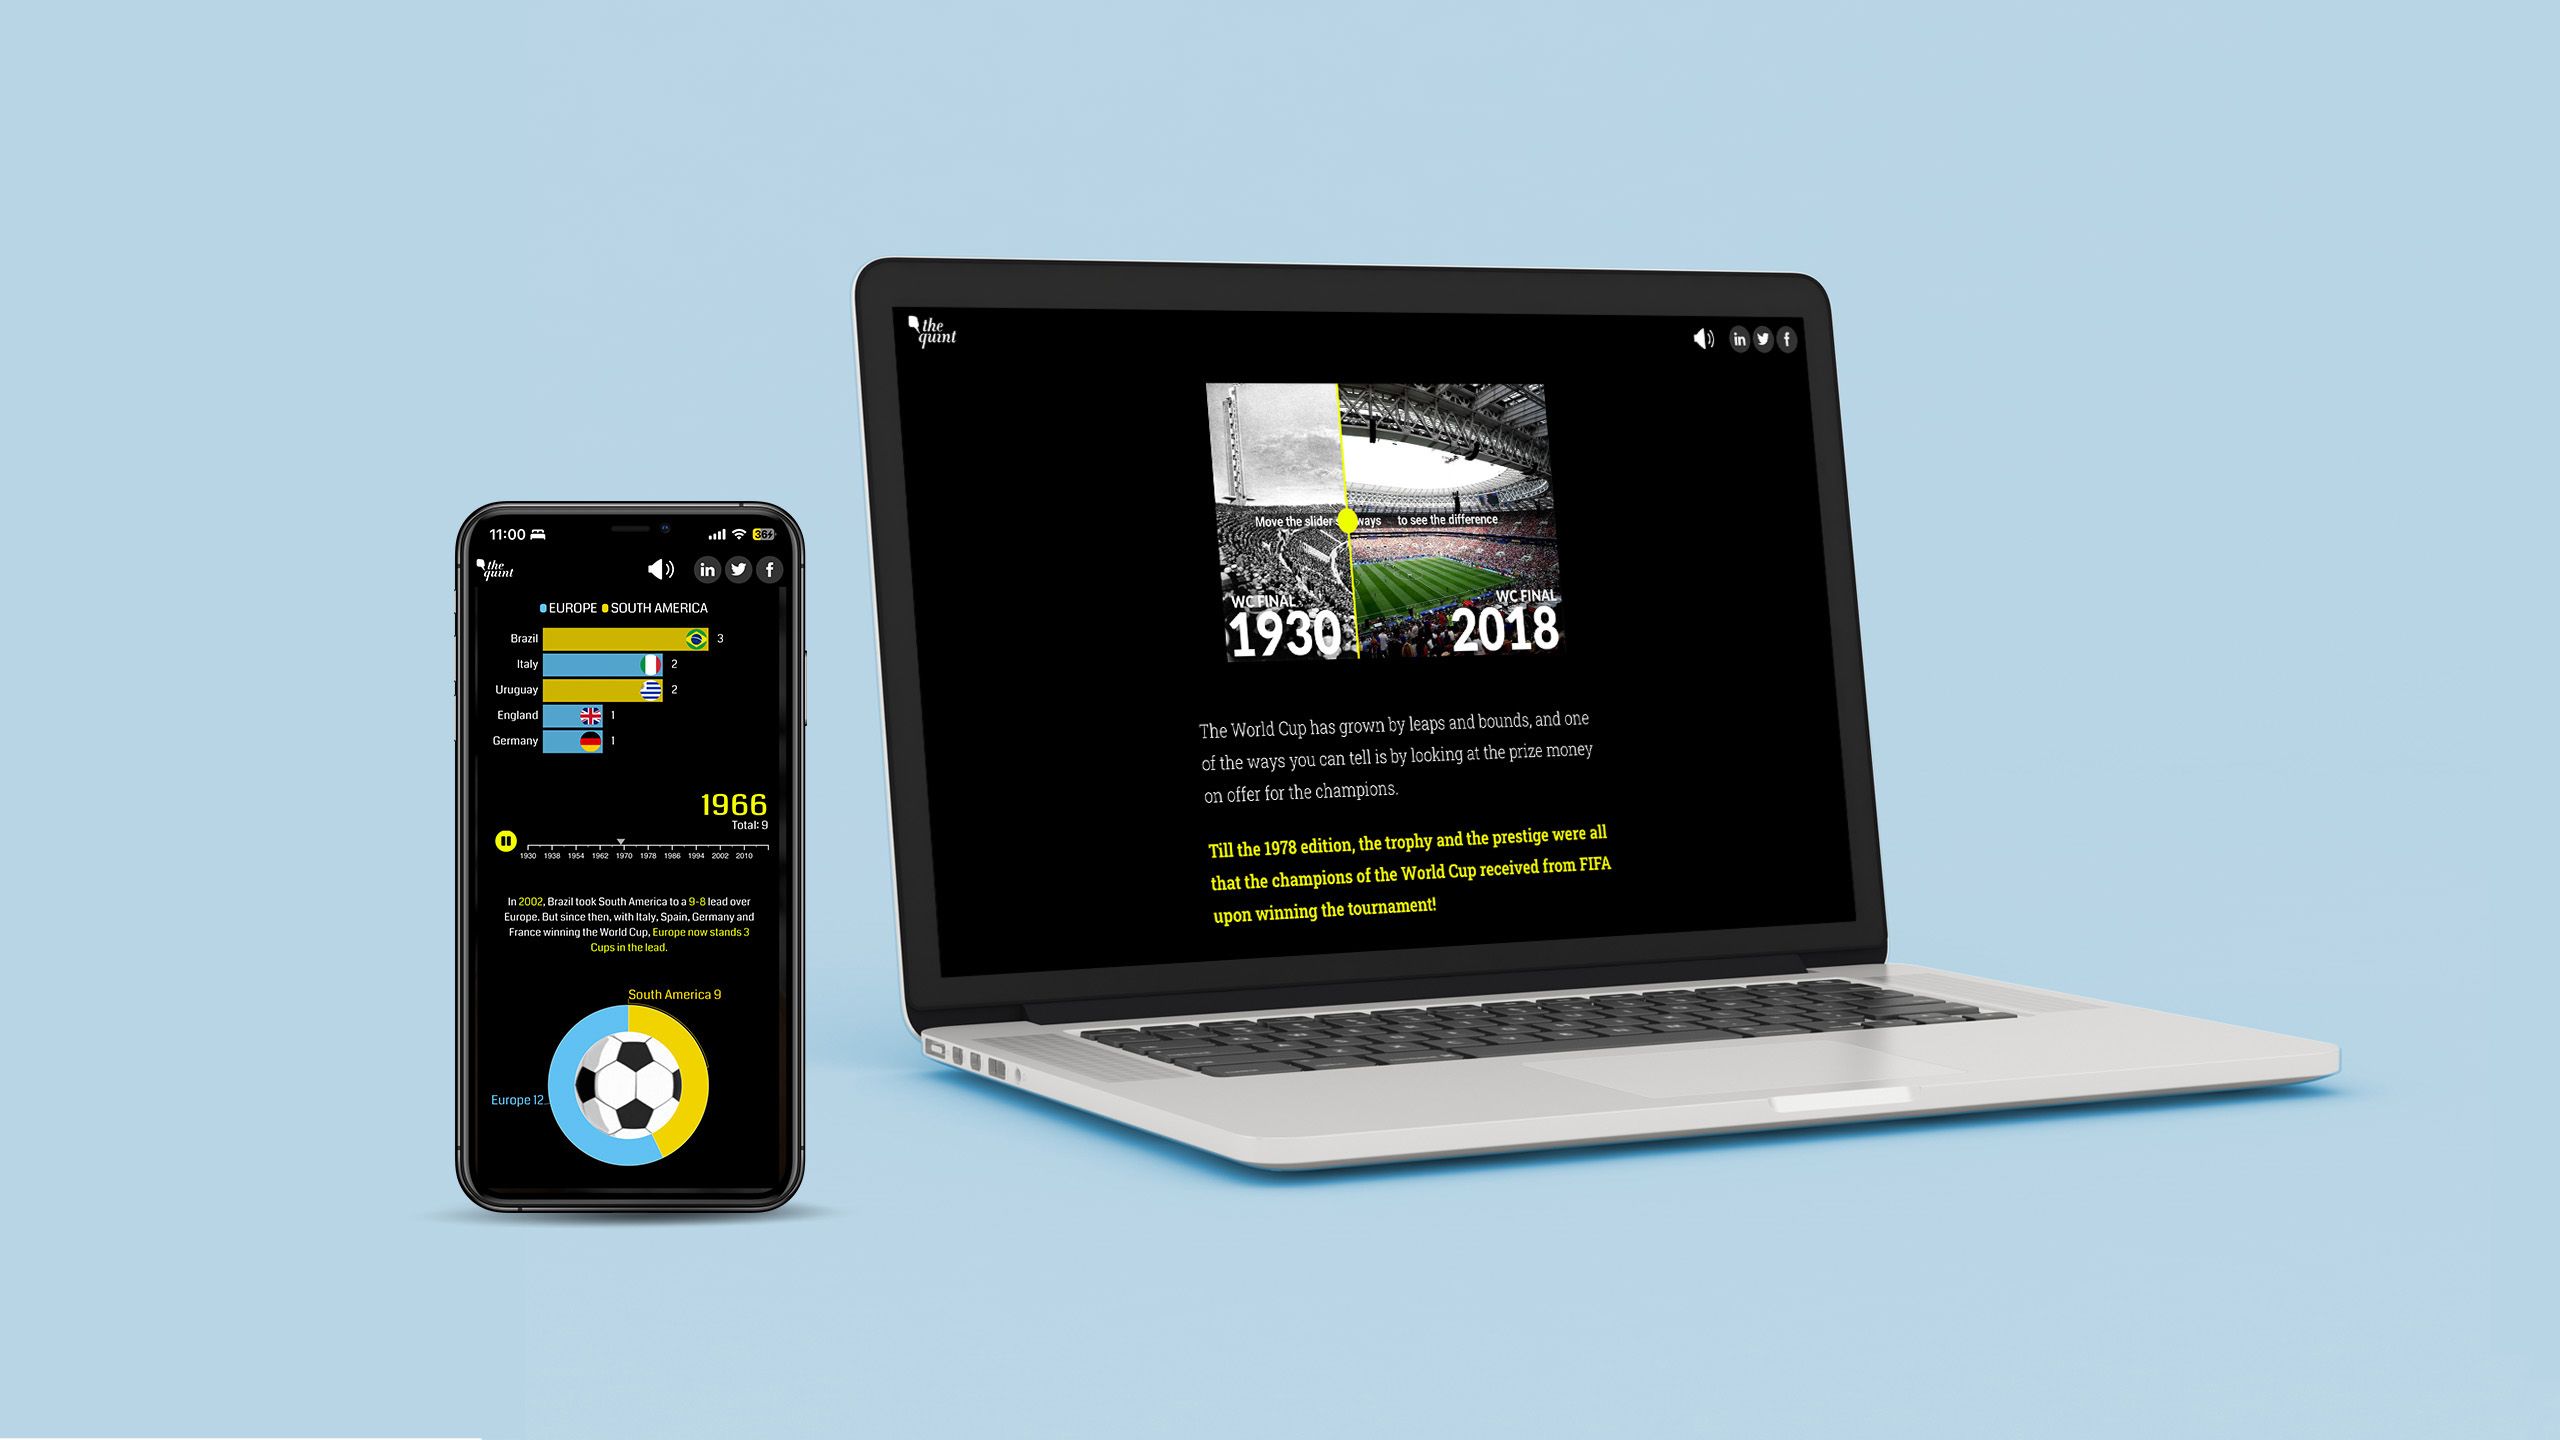
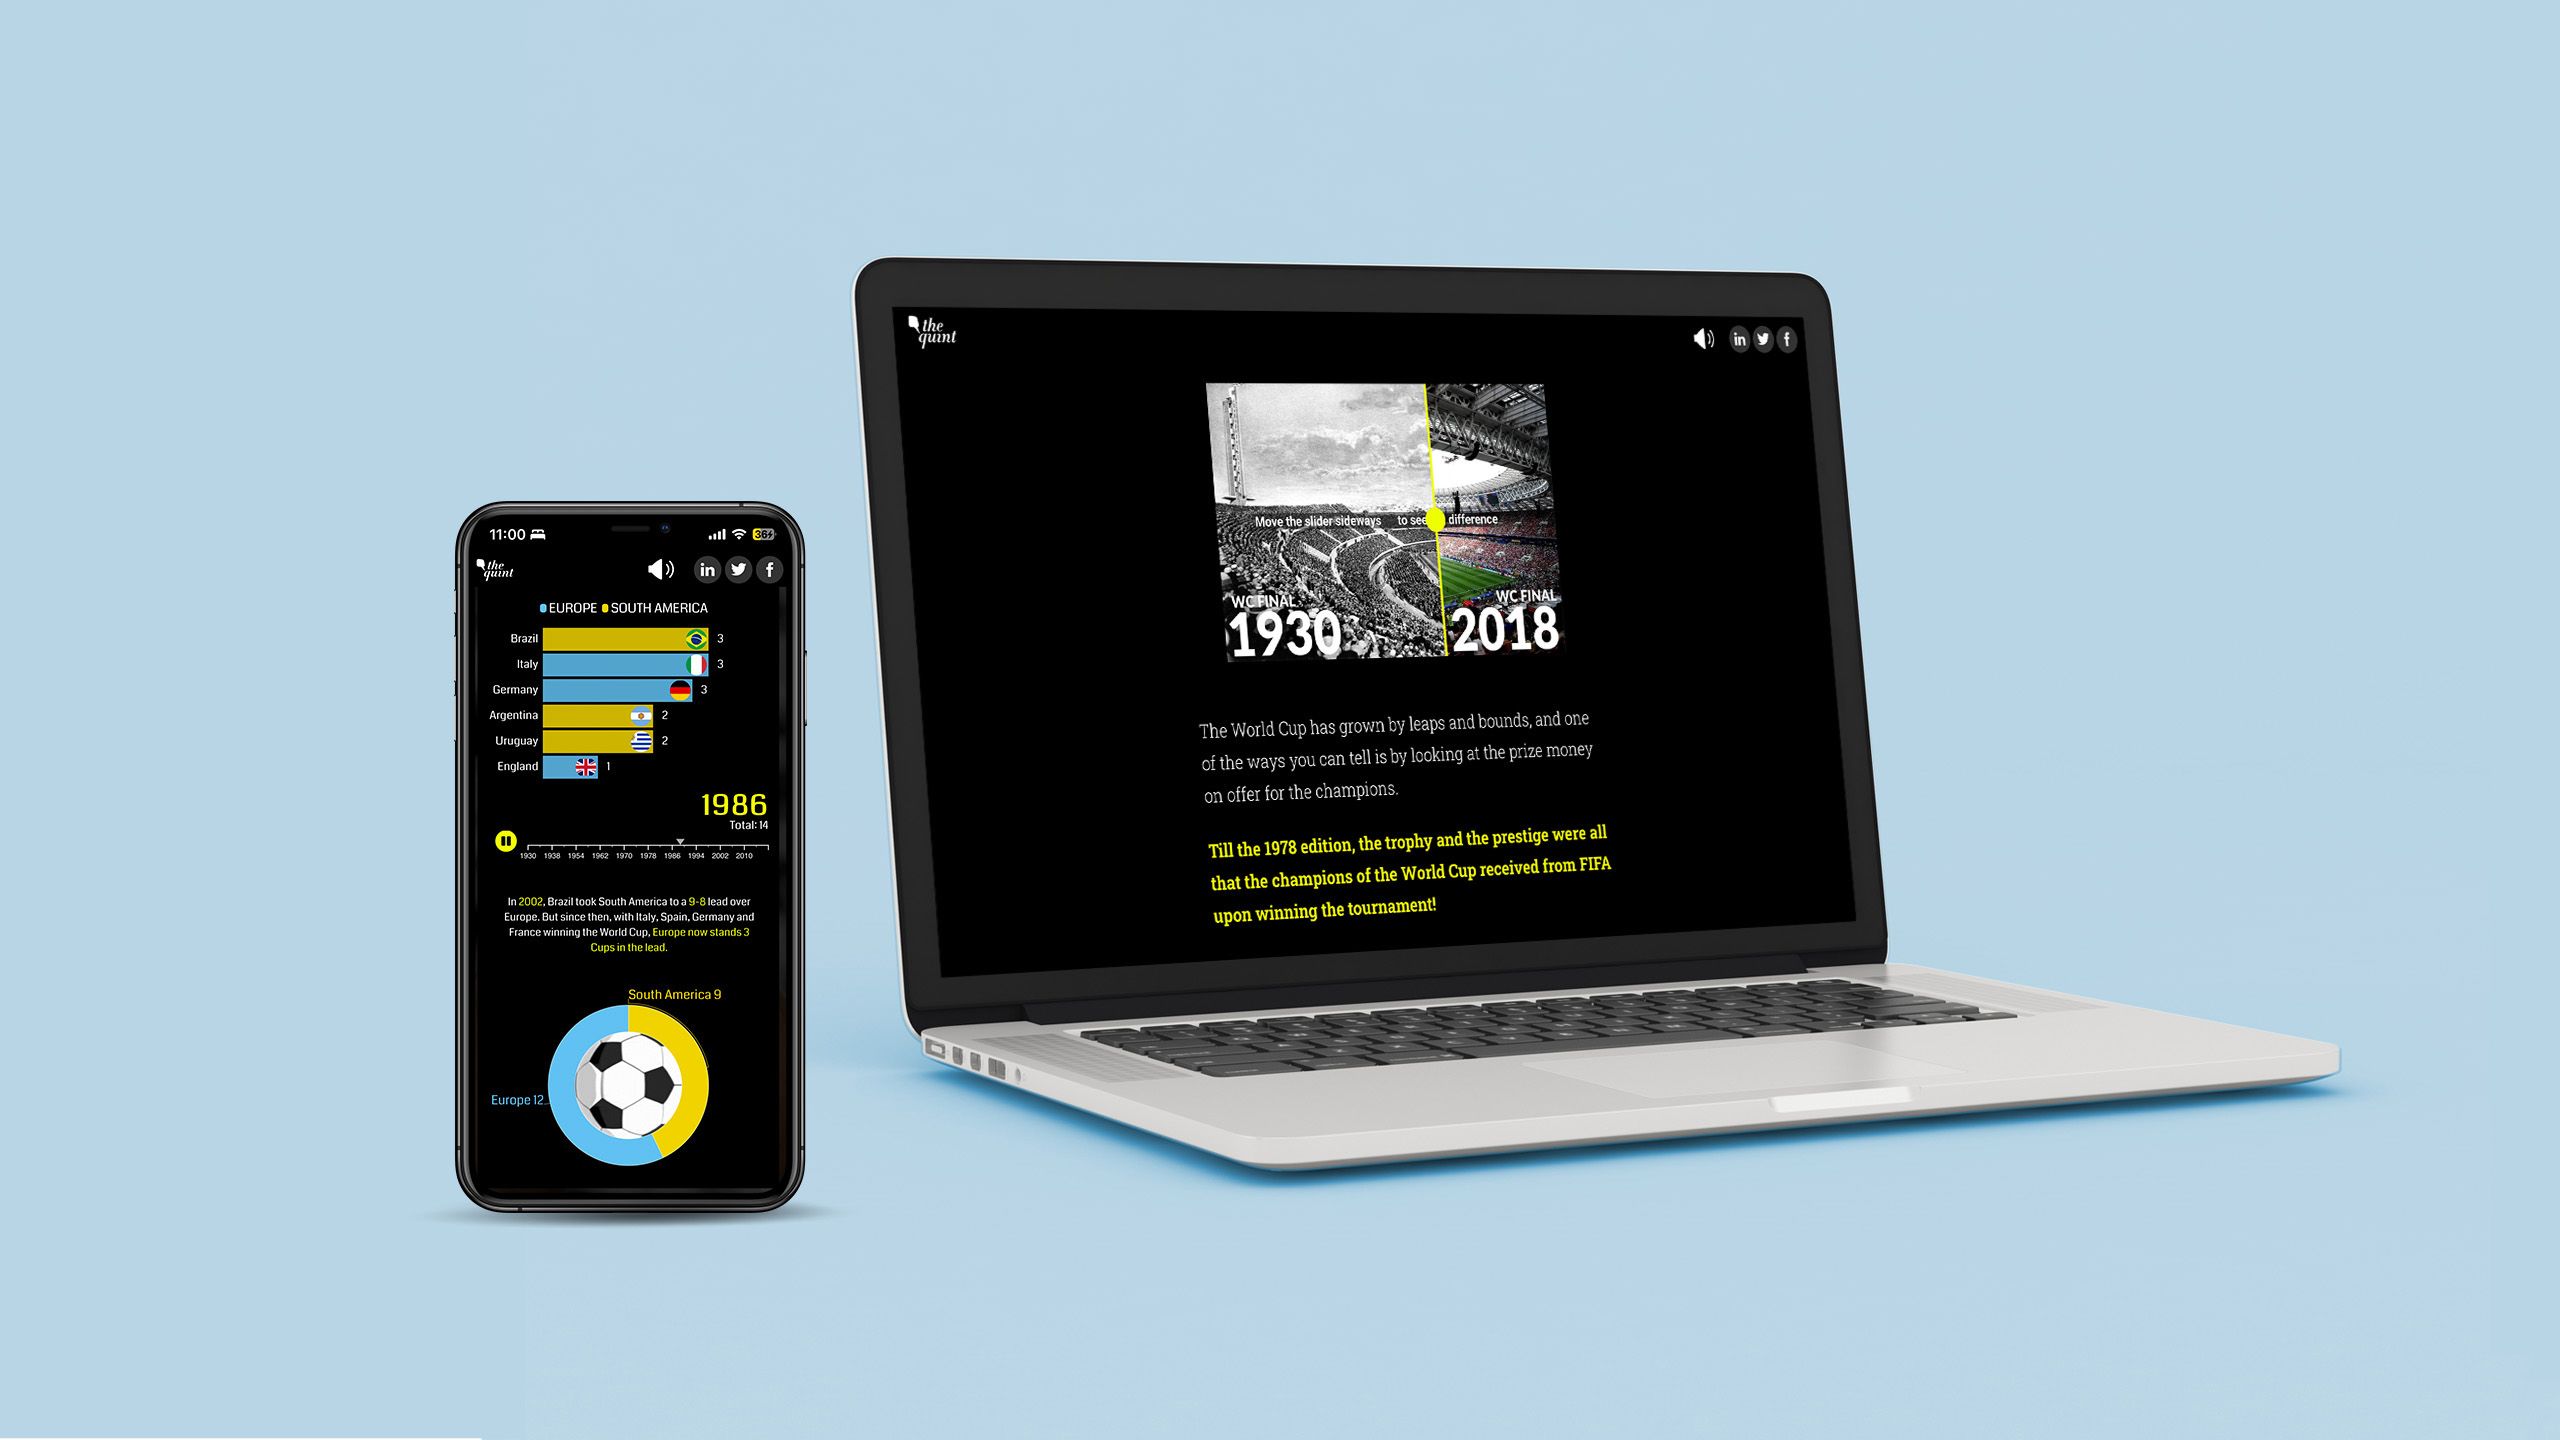
4. FIFA World Cup
What it is: a collection of little-known stories from historical World Cup games.
Who created it: The Quint.
Why we picked this example:
This in-depth history of the FIFA World Cup draws on tons of different media. Videos and photographs set the scene. Interactive elements draw the audience in. Data visualisations help contextualise the tournament’s growth — in terms of viewership, attendance, prize money, goal scoring, and more. All the while, an audio file makes reading the article feel just like sitting in the stands at a match.


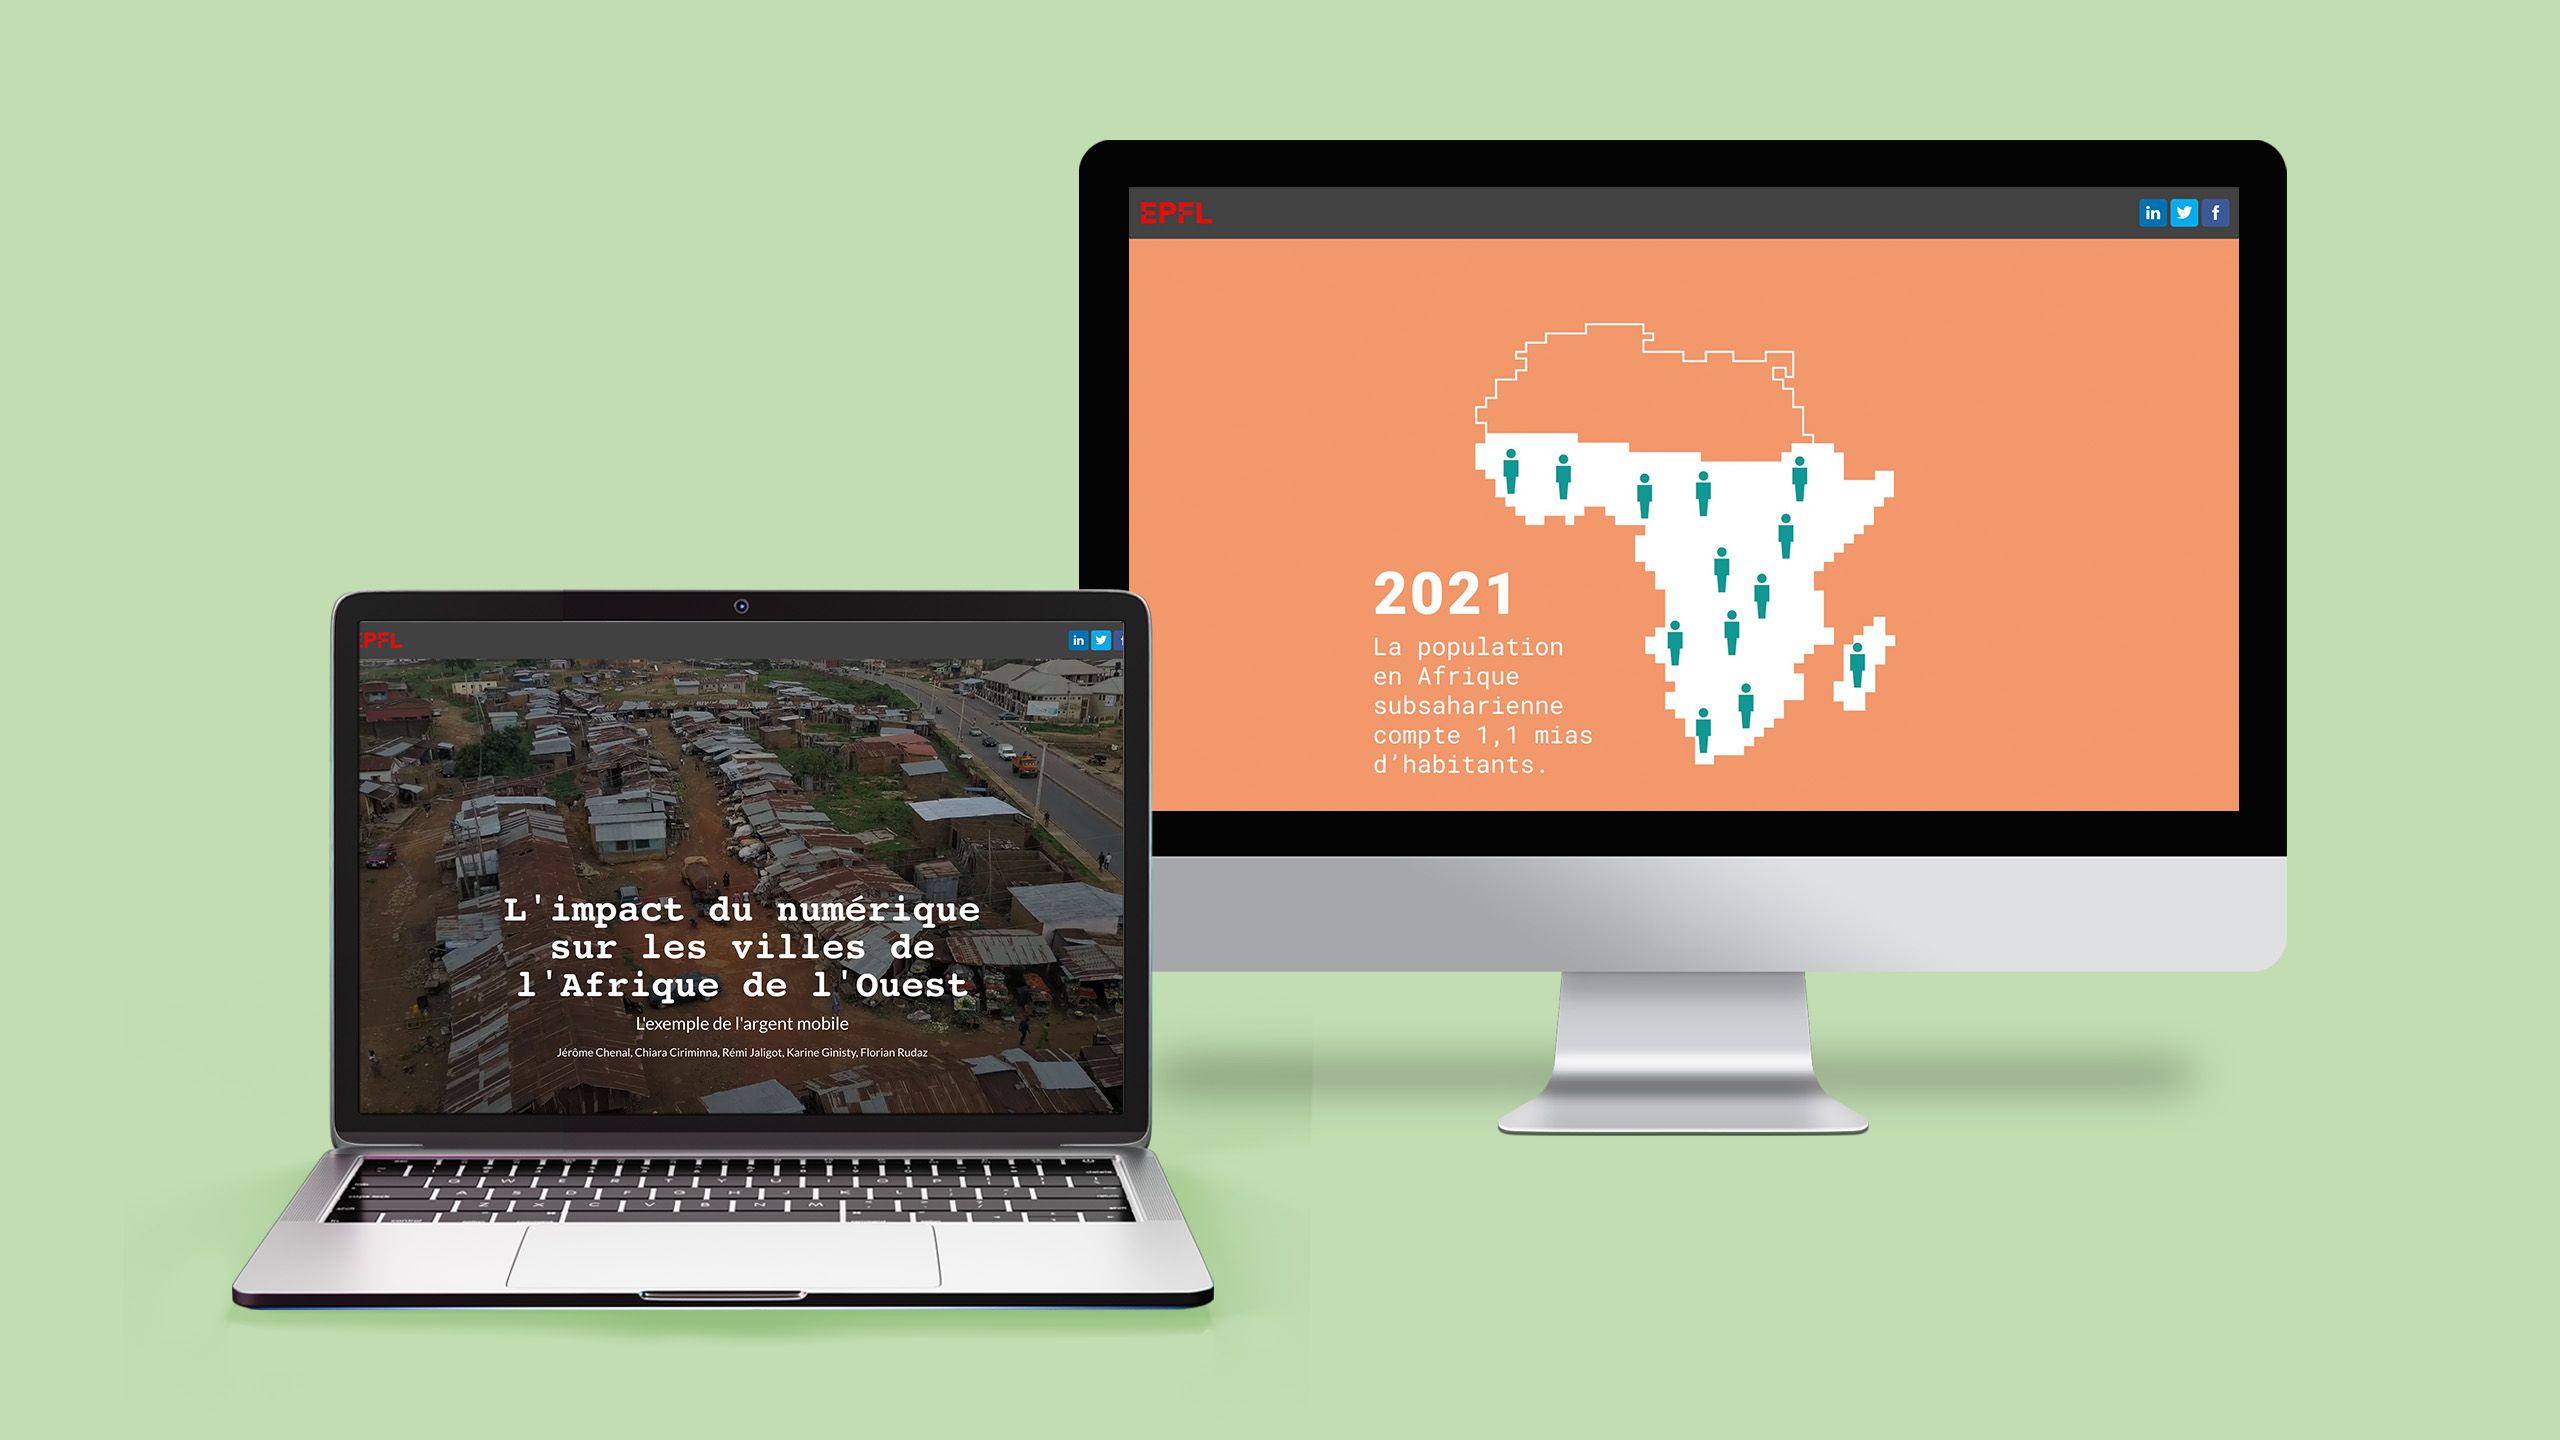
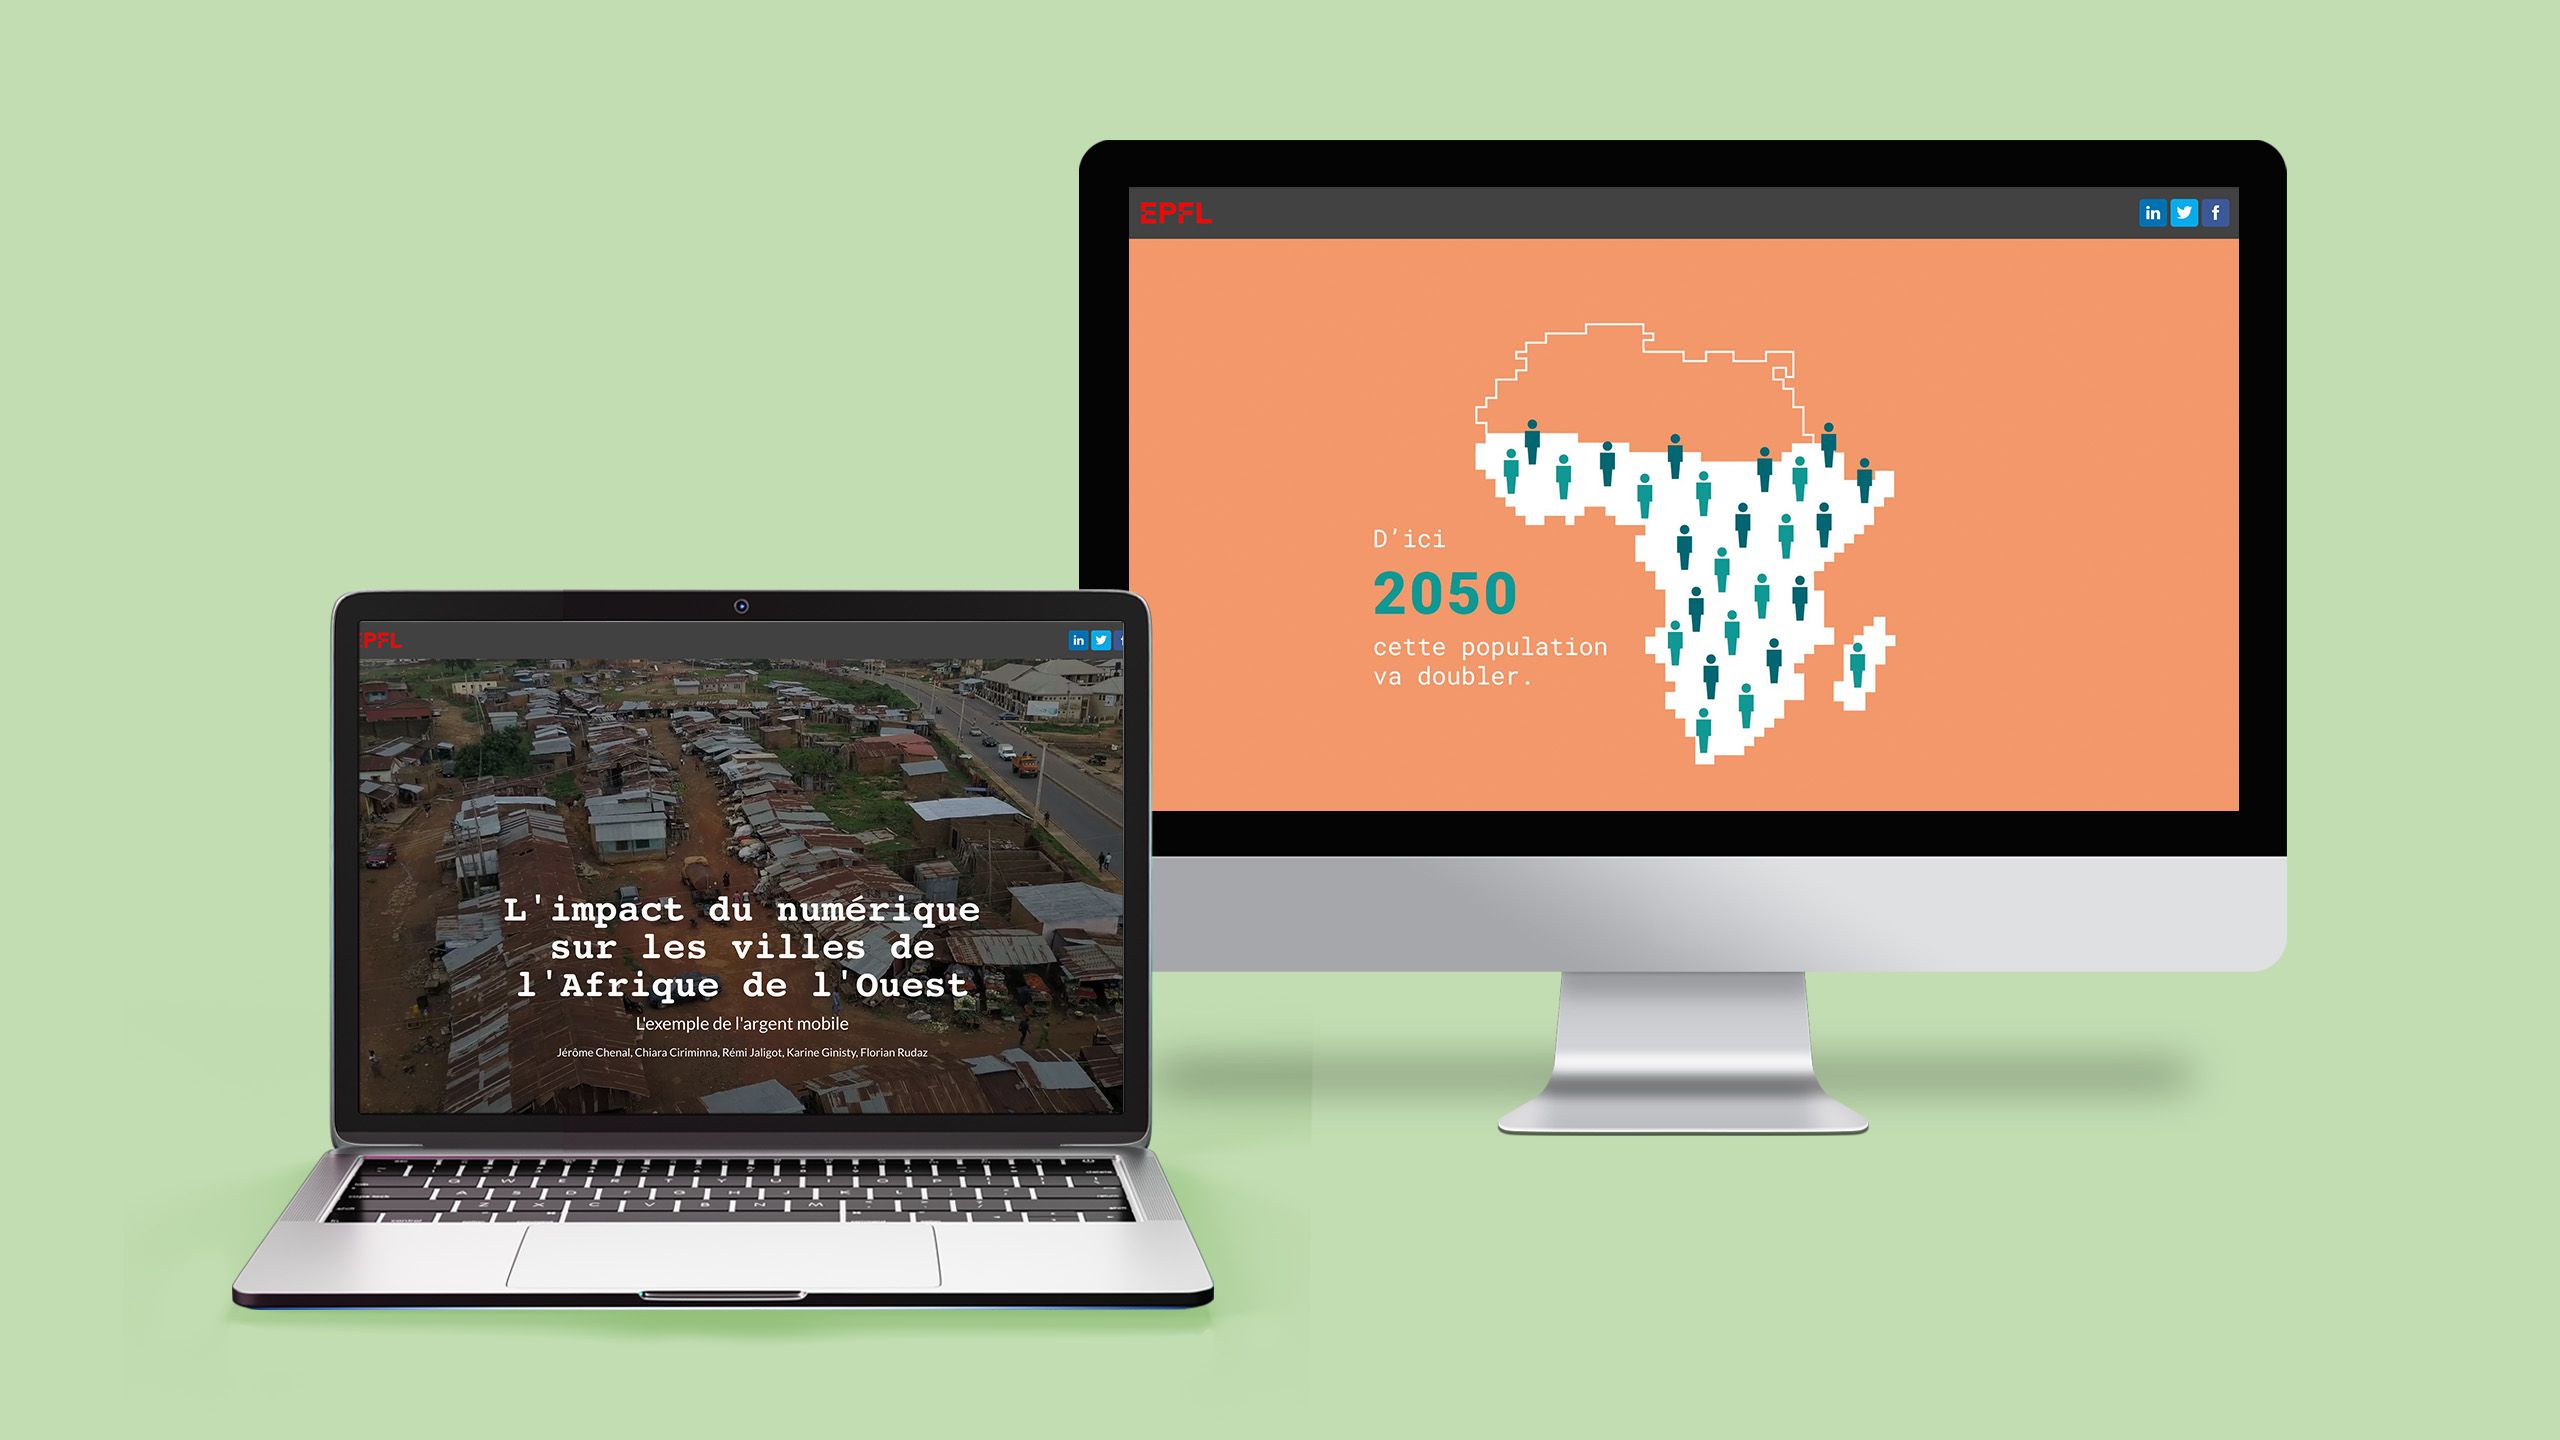
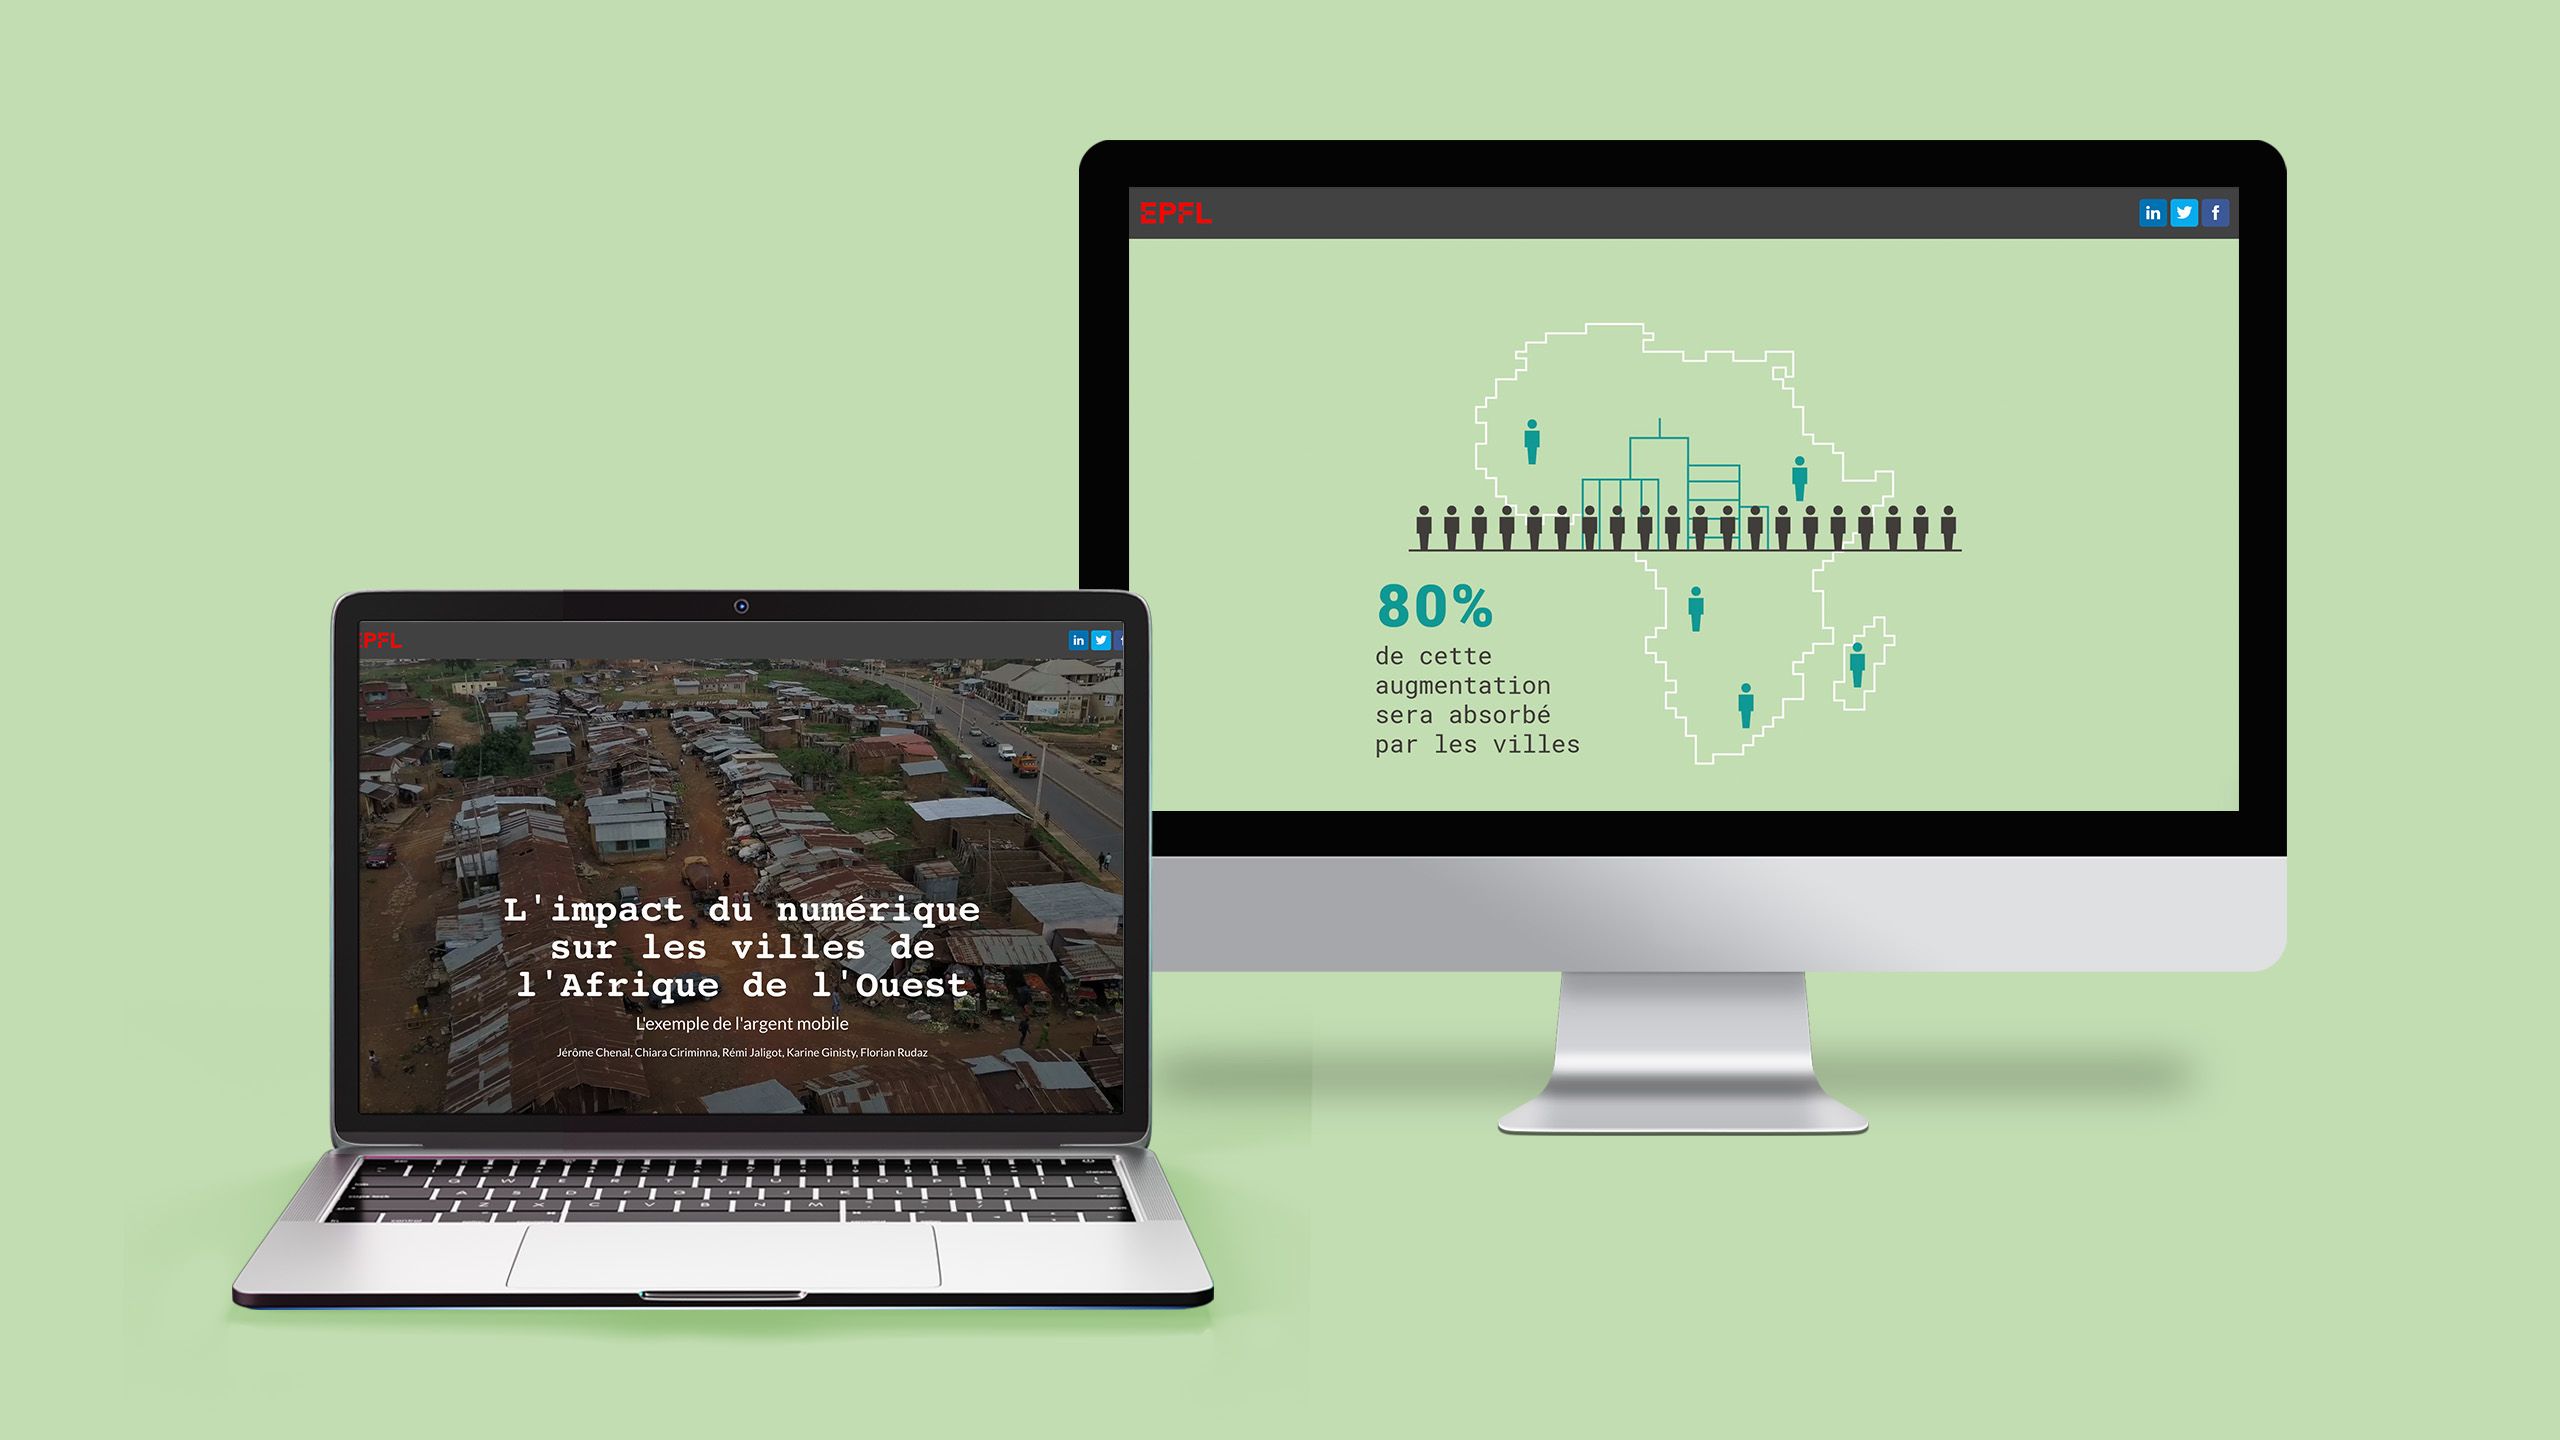
5. L'impact du numérique sur les villes de l'Afrique de l'Ouest
What it is: a report on the impact of digital technology in West Africa.
Who created it: EPFL.
Why we picked this example:
This report from EPFL uses illustrations throughout to create a unified visual style and break up text. But our favourite part is how the creators use compelling, dynamic data visualisations in a variety of ways. They use illustrated maps, interactive graphs, and even workflows to help the audience quickly grasp the important numbers — all of which fit in perfectly with that overarching style.


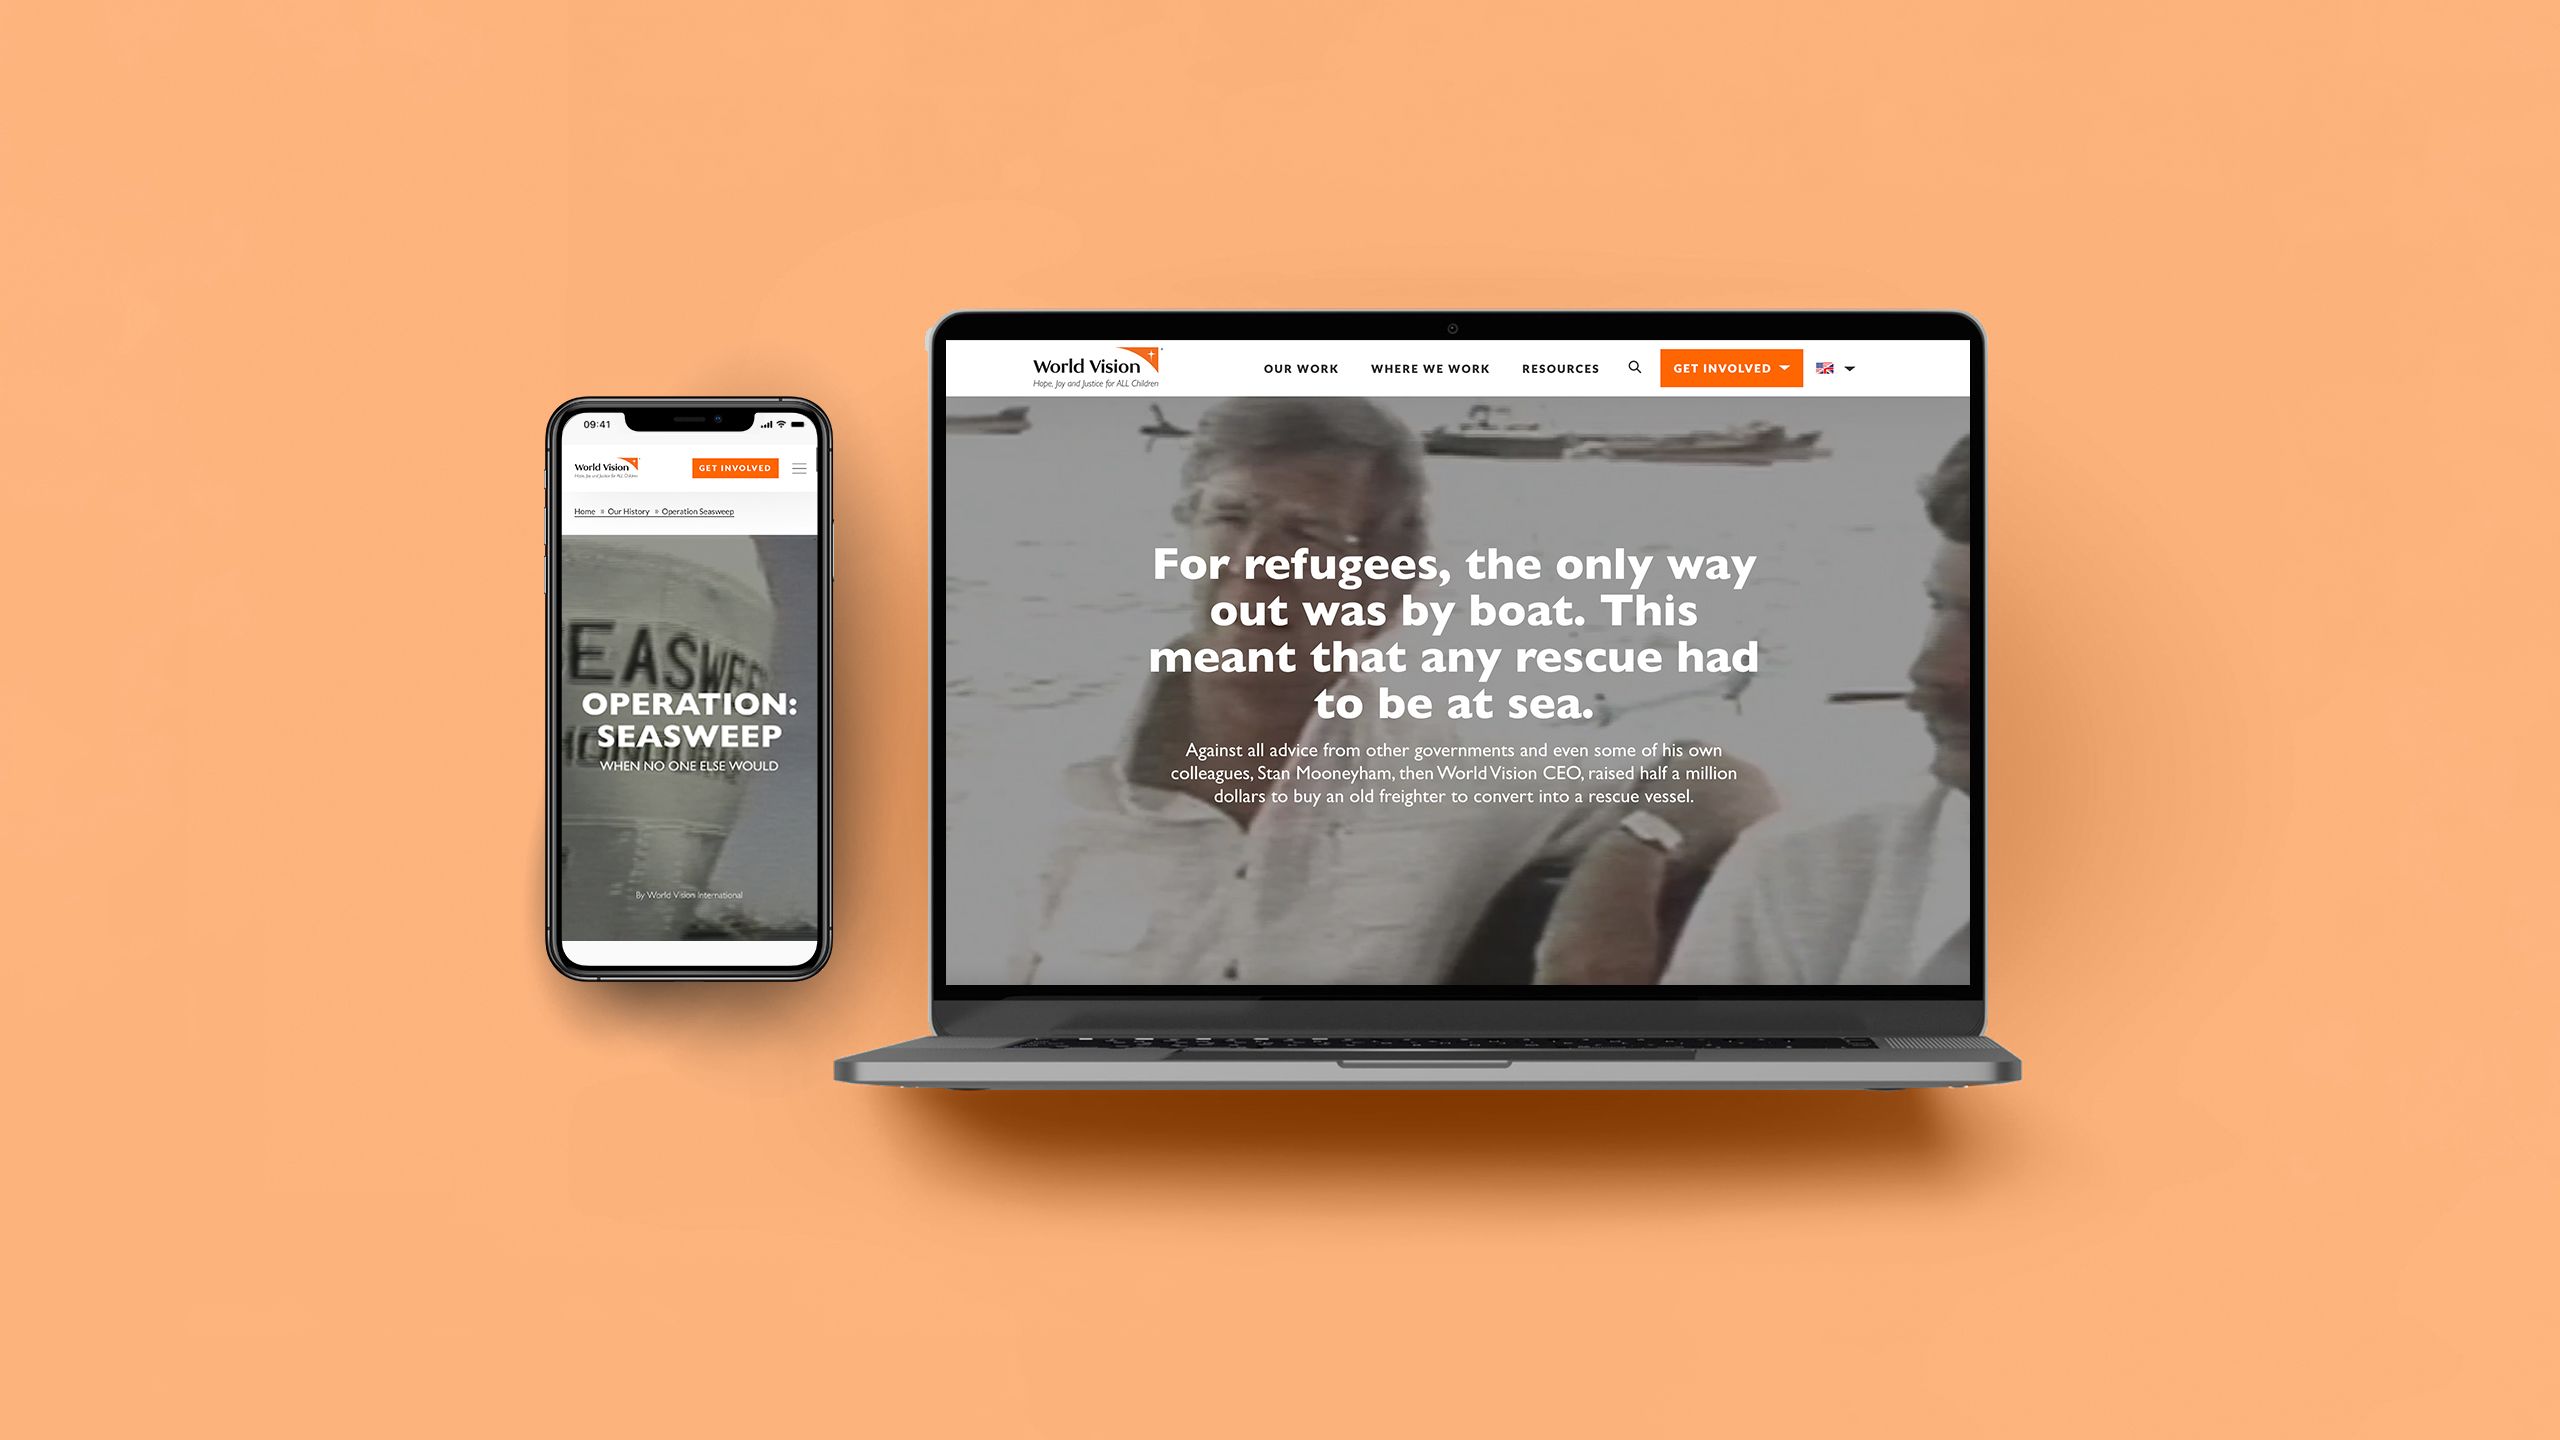
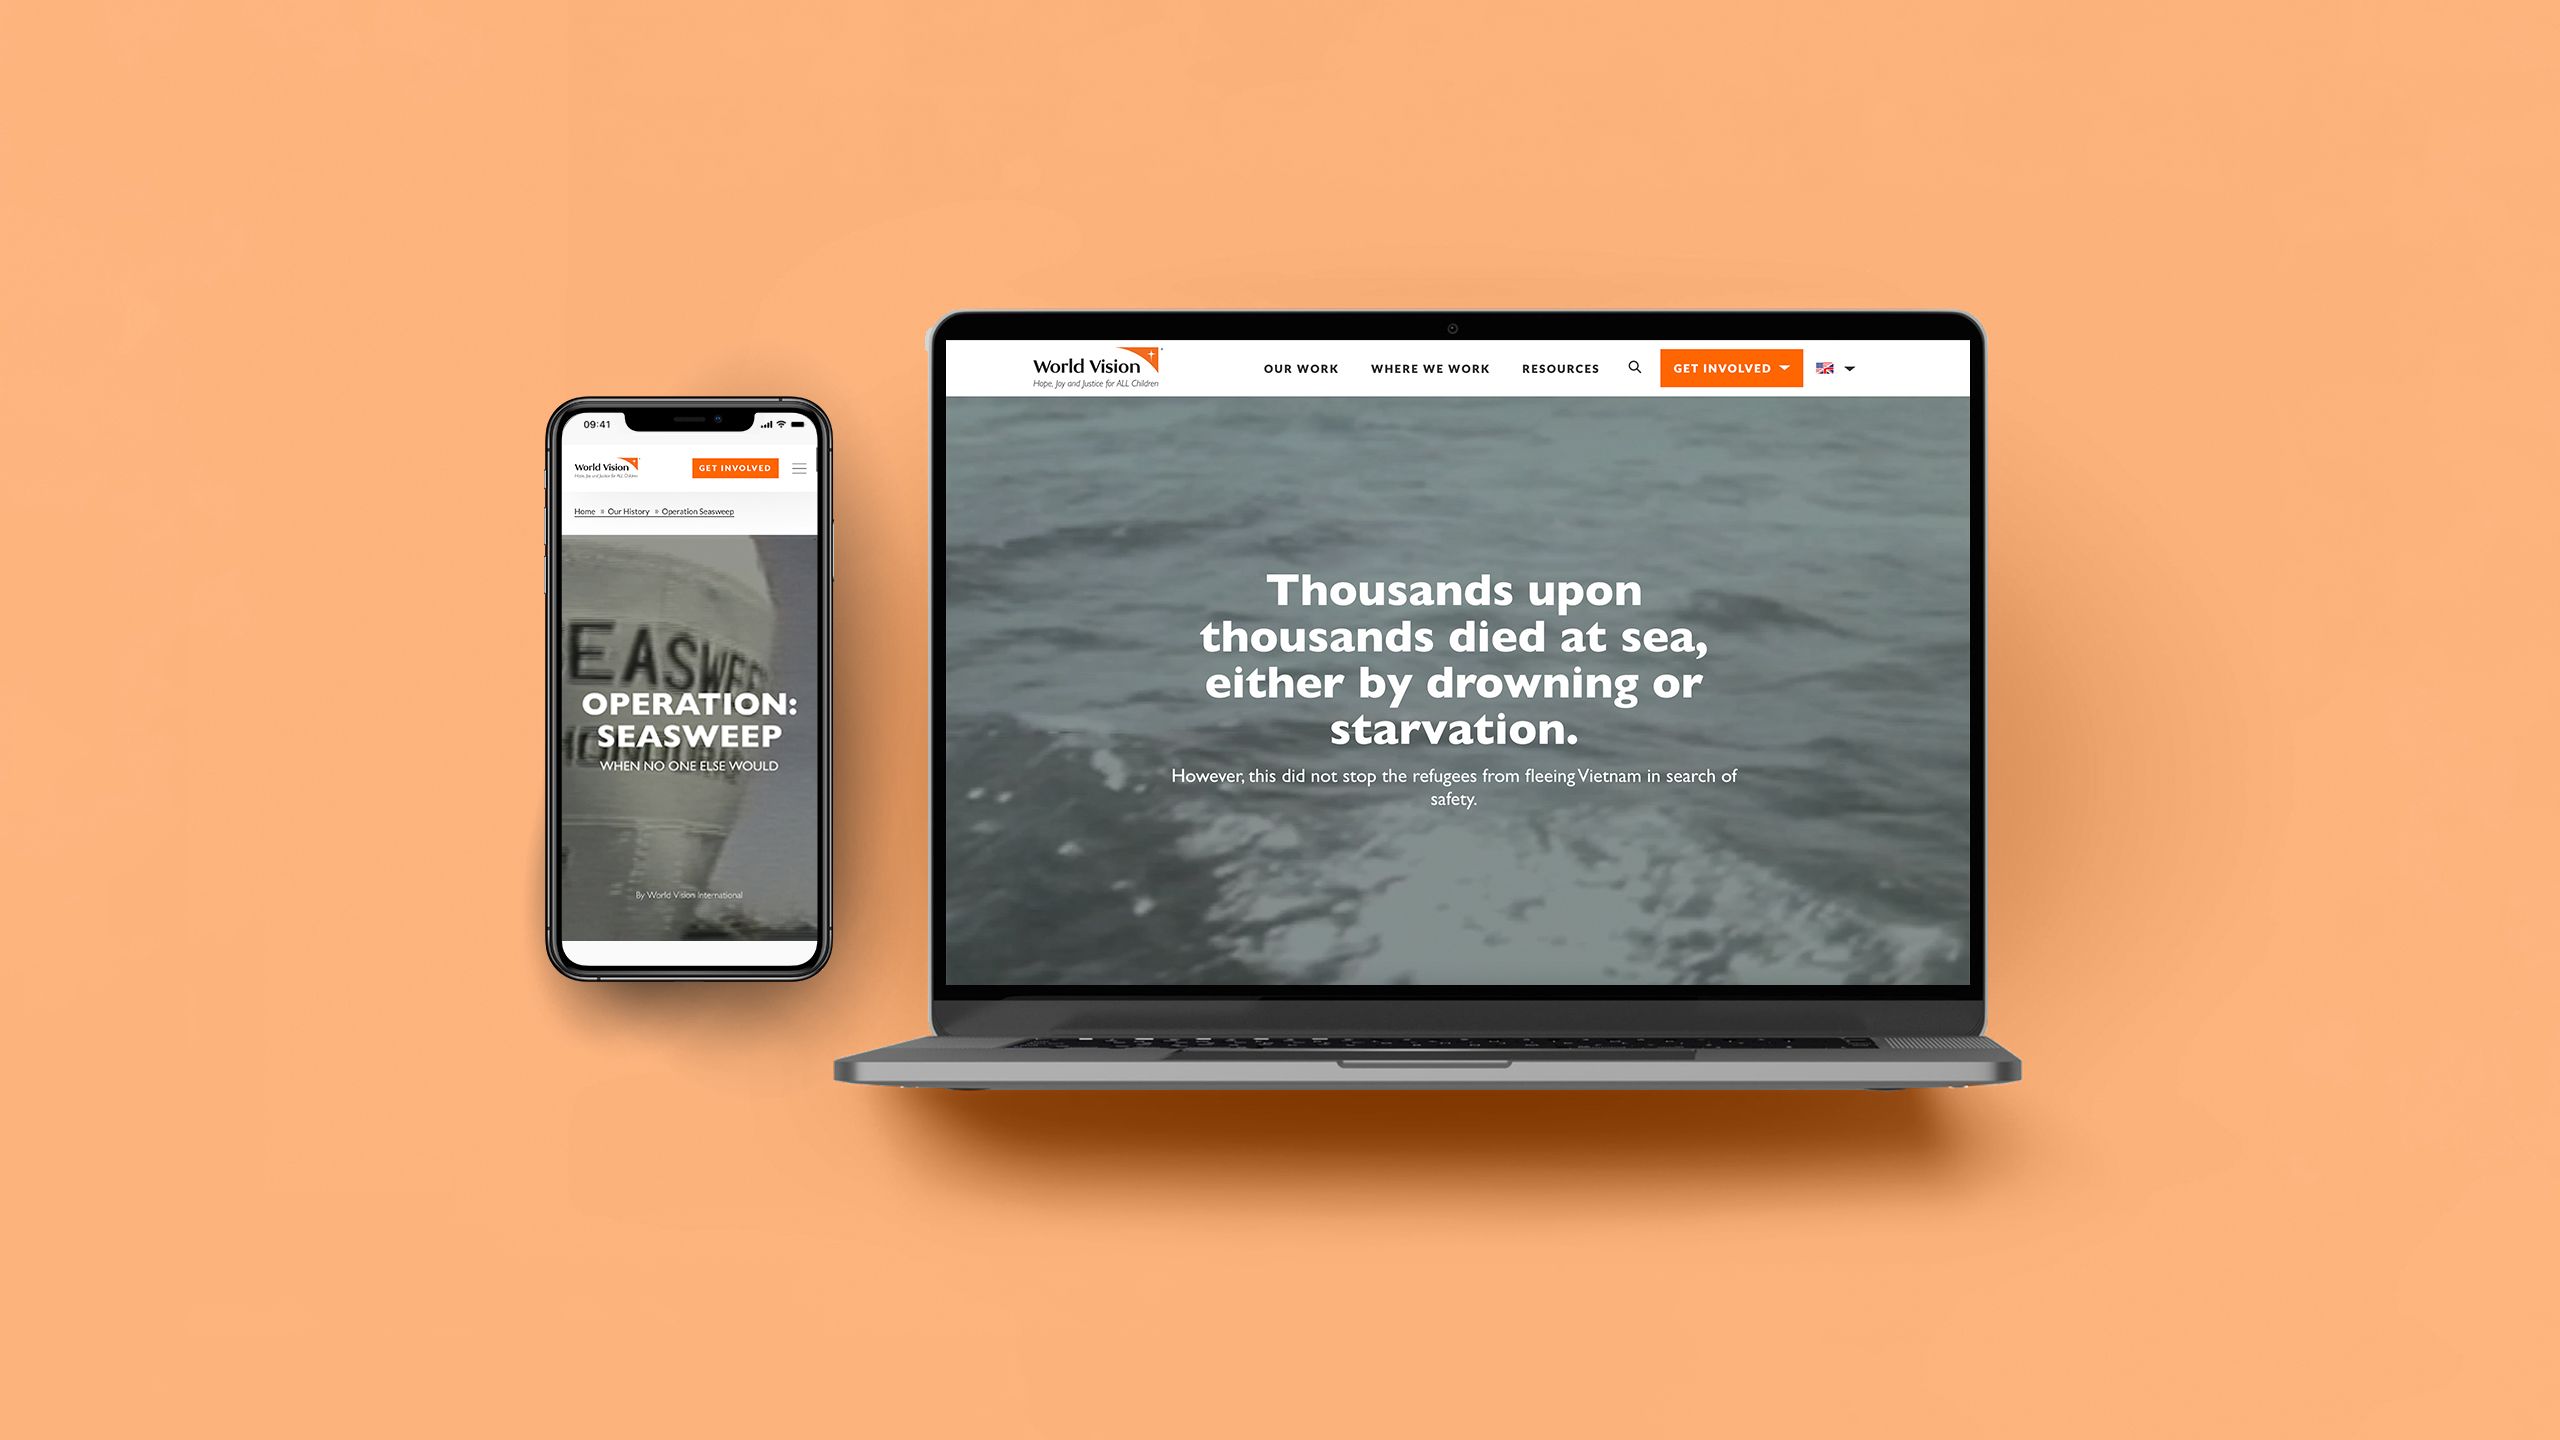
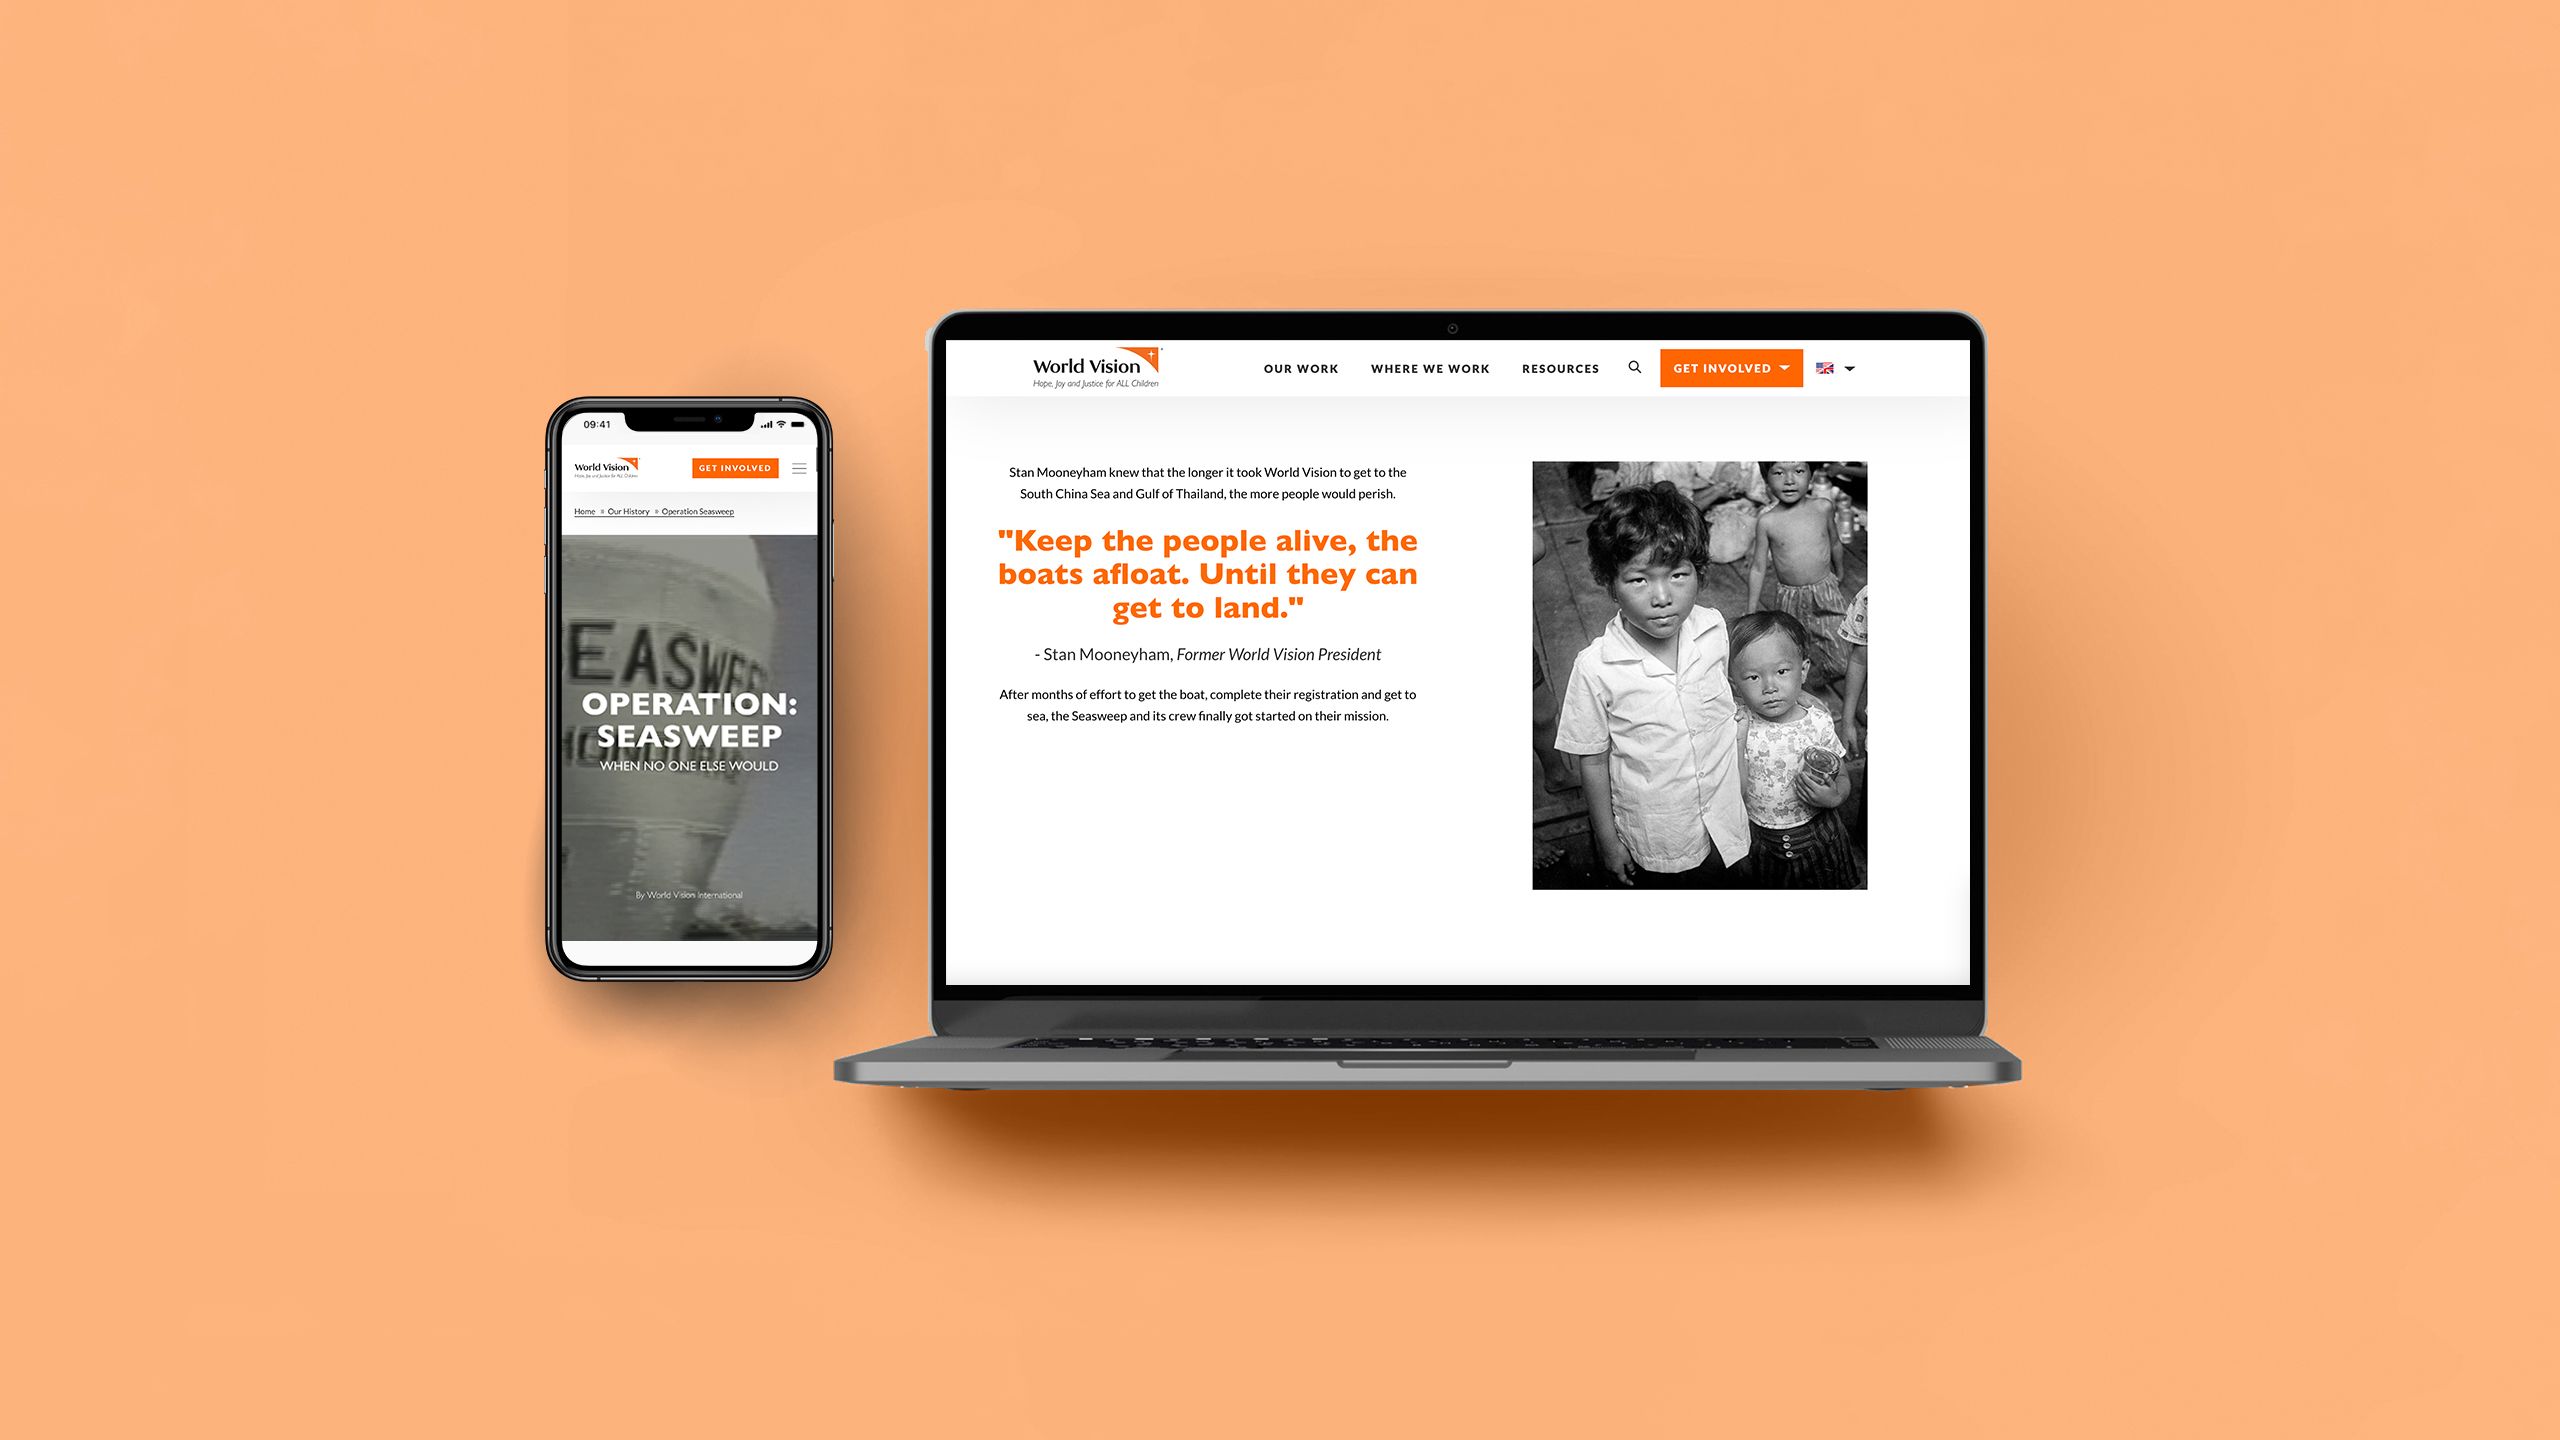
6. OPERATION: SEASWEEP
What it is: the story of a nonprofit’s mission to rescue refugees stranded at sea.
Who created it: World Vision International.
Why we picked this example:
The story told in this piece is an emotional one. While that can be difficult to fully convey via a written narrative, World Vision International draws on a number of videos and photographs that do the heavy lifting. It makes for a fundamentally human story that’s much more powerful than text alone.


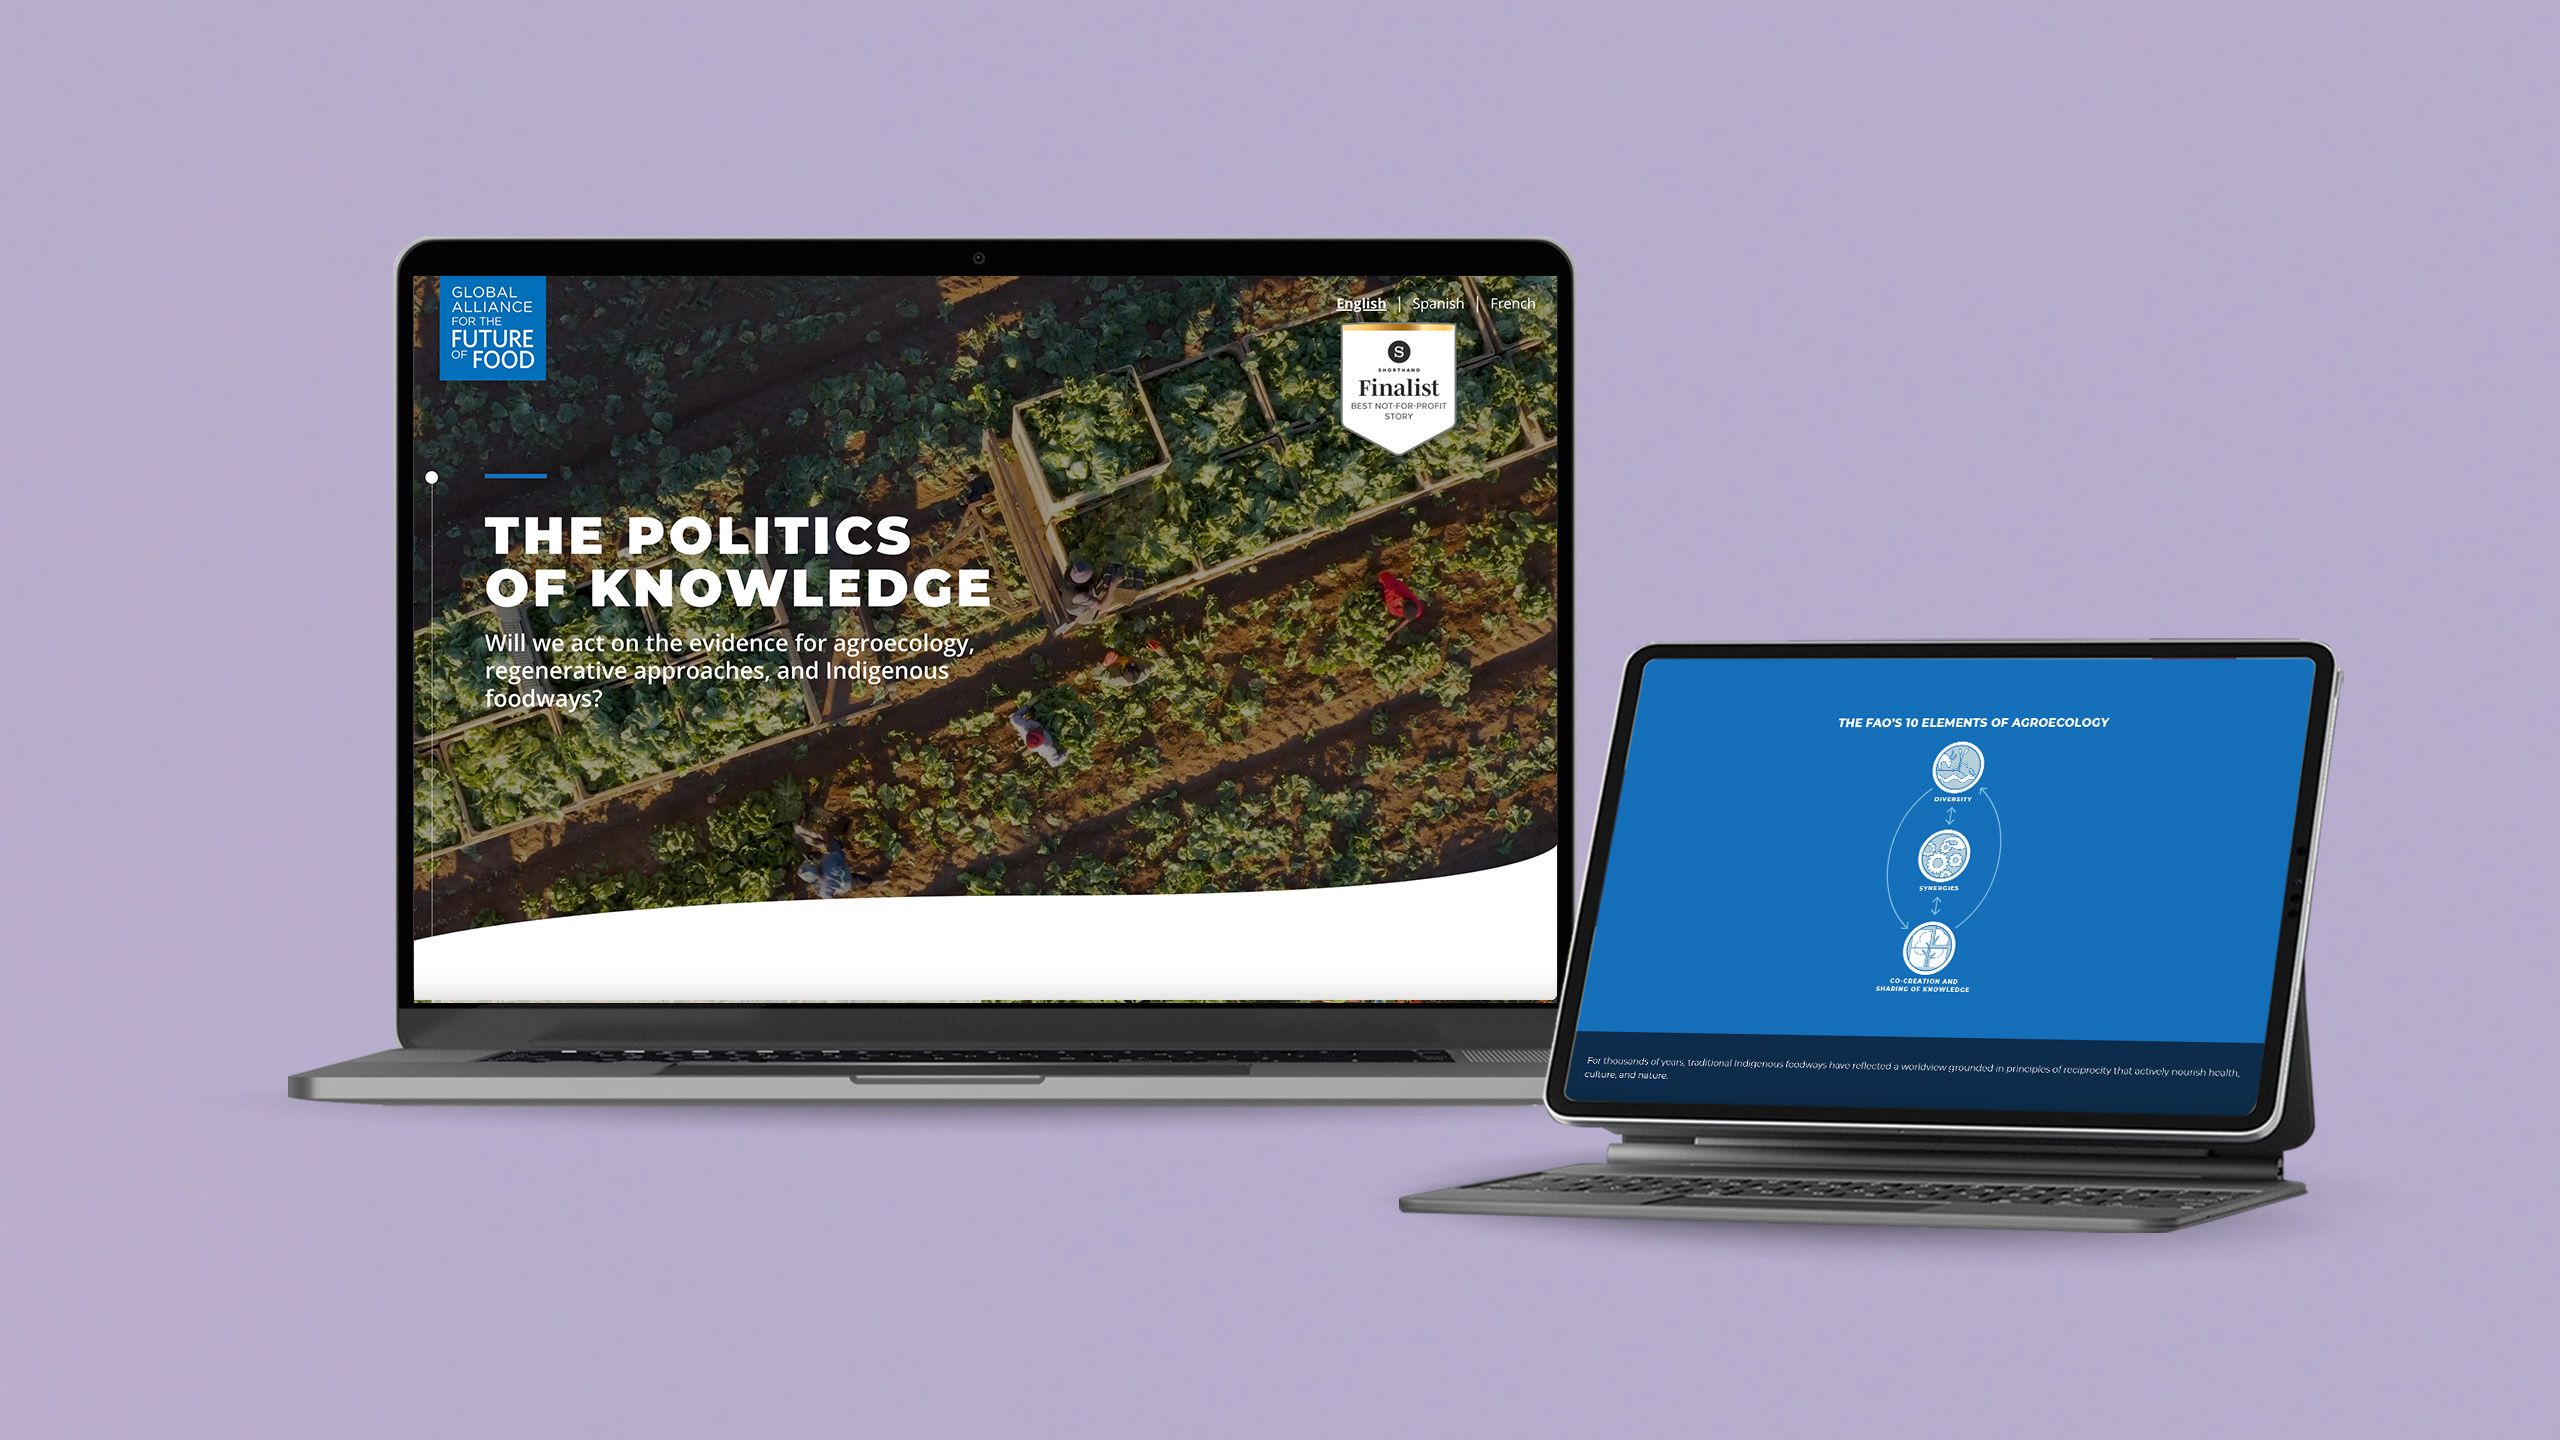
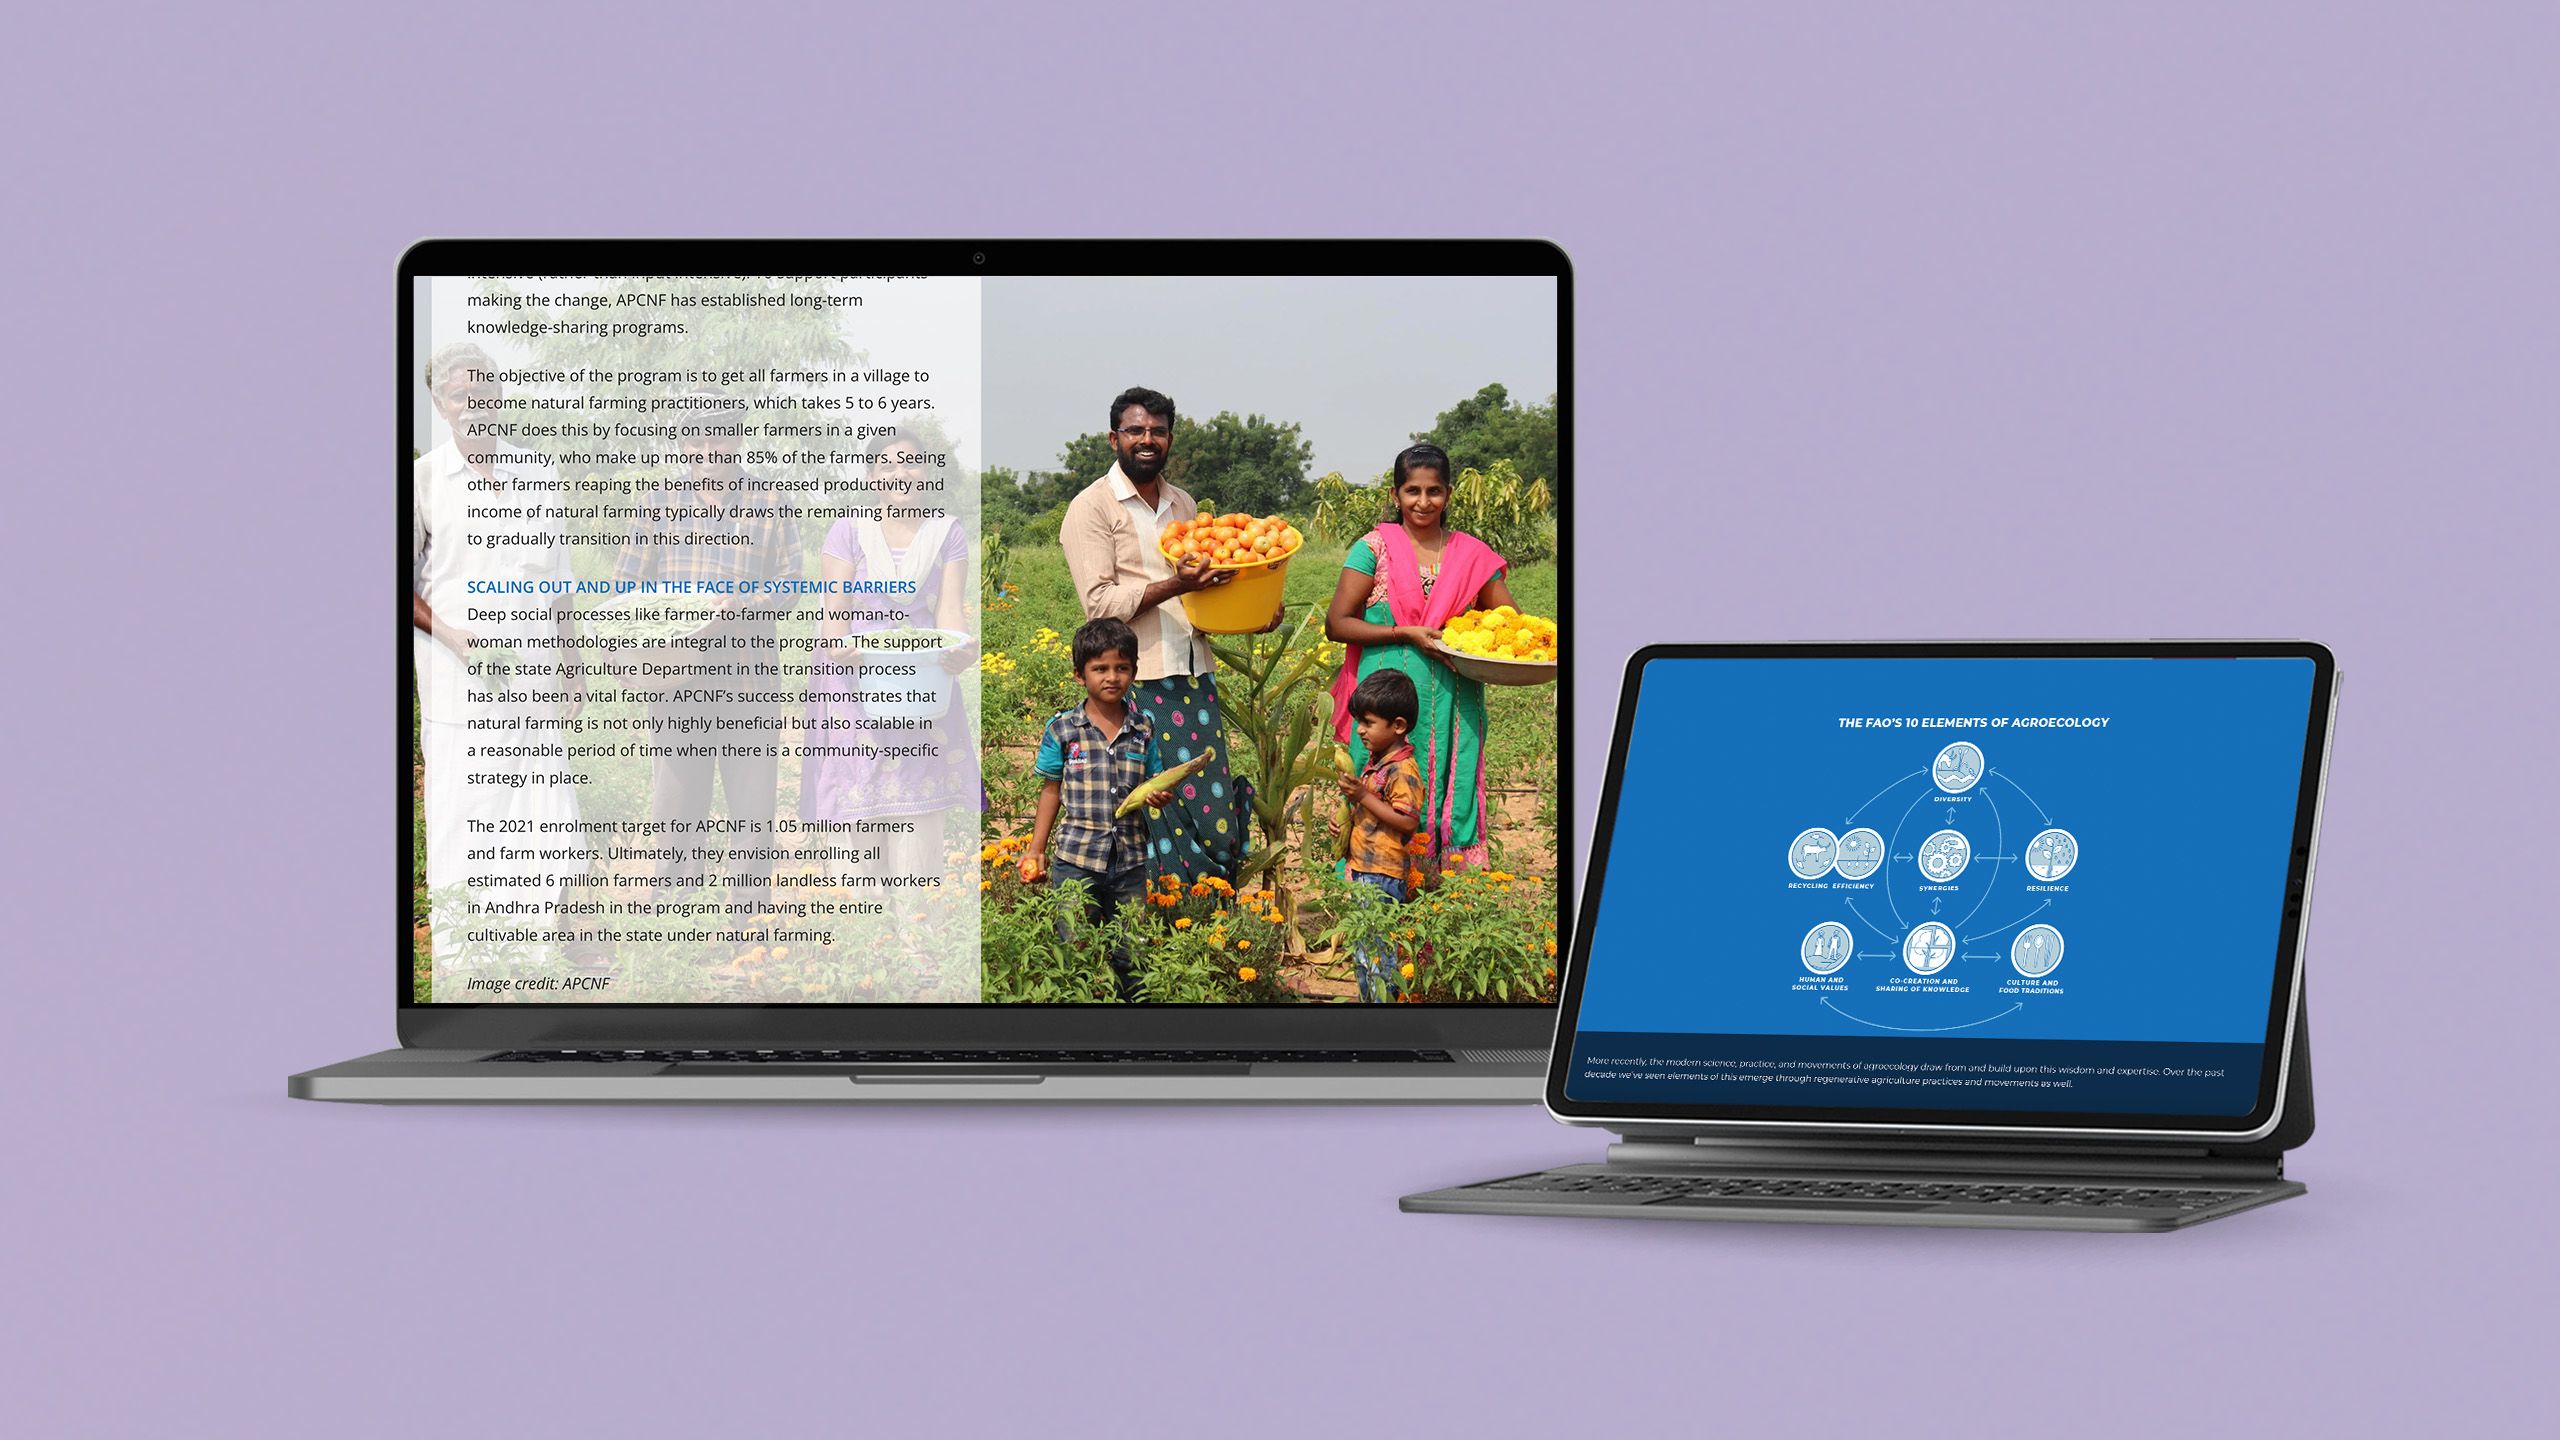
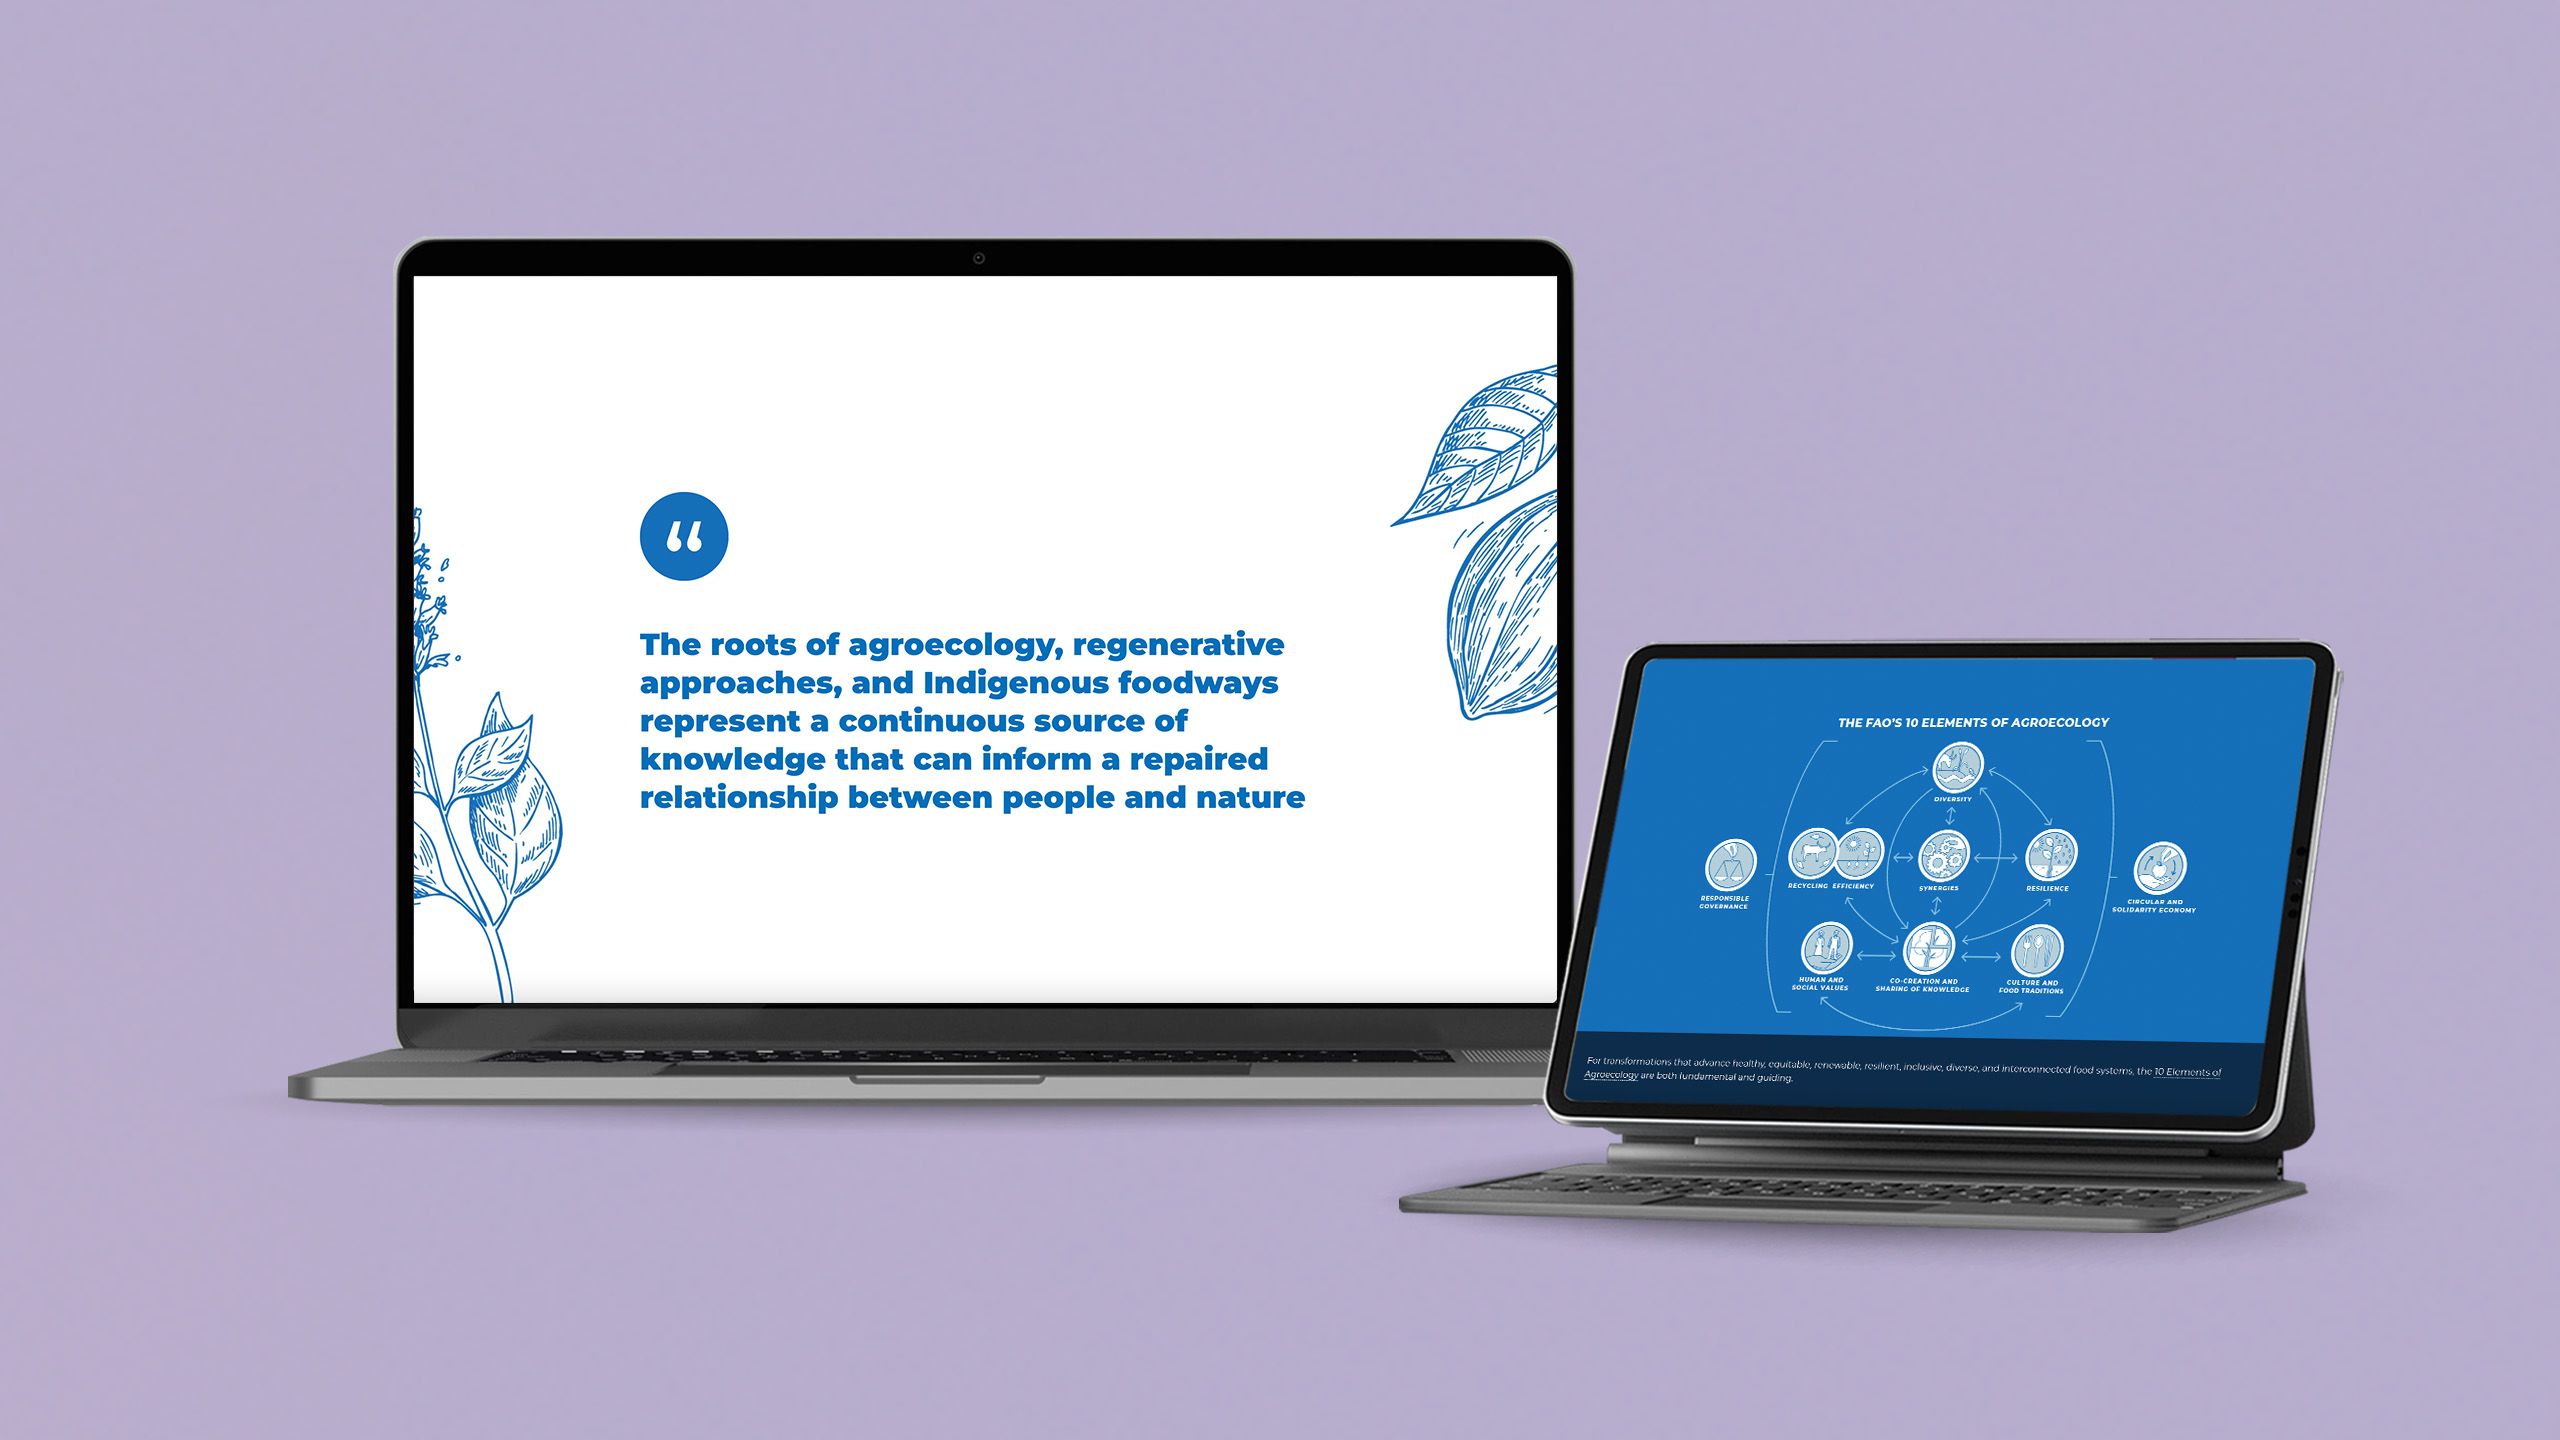
7. THE POLITICS OF KNOWLEDGE
What it is: an in-depth report on the evidence for — and resistance to — agroecology, regenerative approaches, and Indigenous foodways.
Who created it: Global Alliance for the Future of Food.
Why we picked this example:
This nonprofit report is a great example of using graphic design to make a story more digestible on the web. It uses plenty of photographs and video, but what really stands out are the graphic elements, like the visual depiction of the 10 elements of agroecology. The story also uses varied typography, like pull quotes, to break up the text, as well as visually distinct graphic boxes for the case studies.


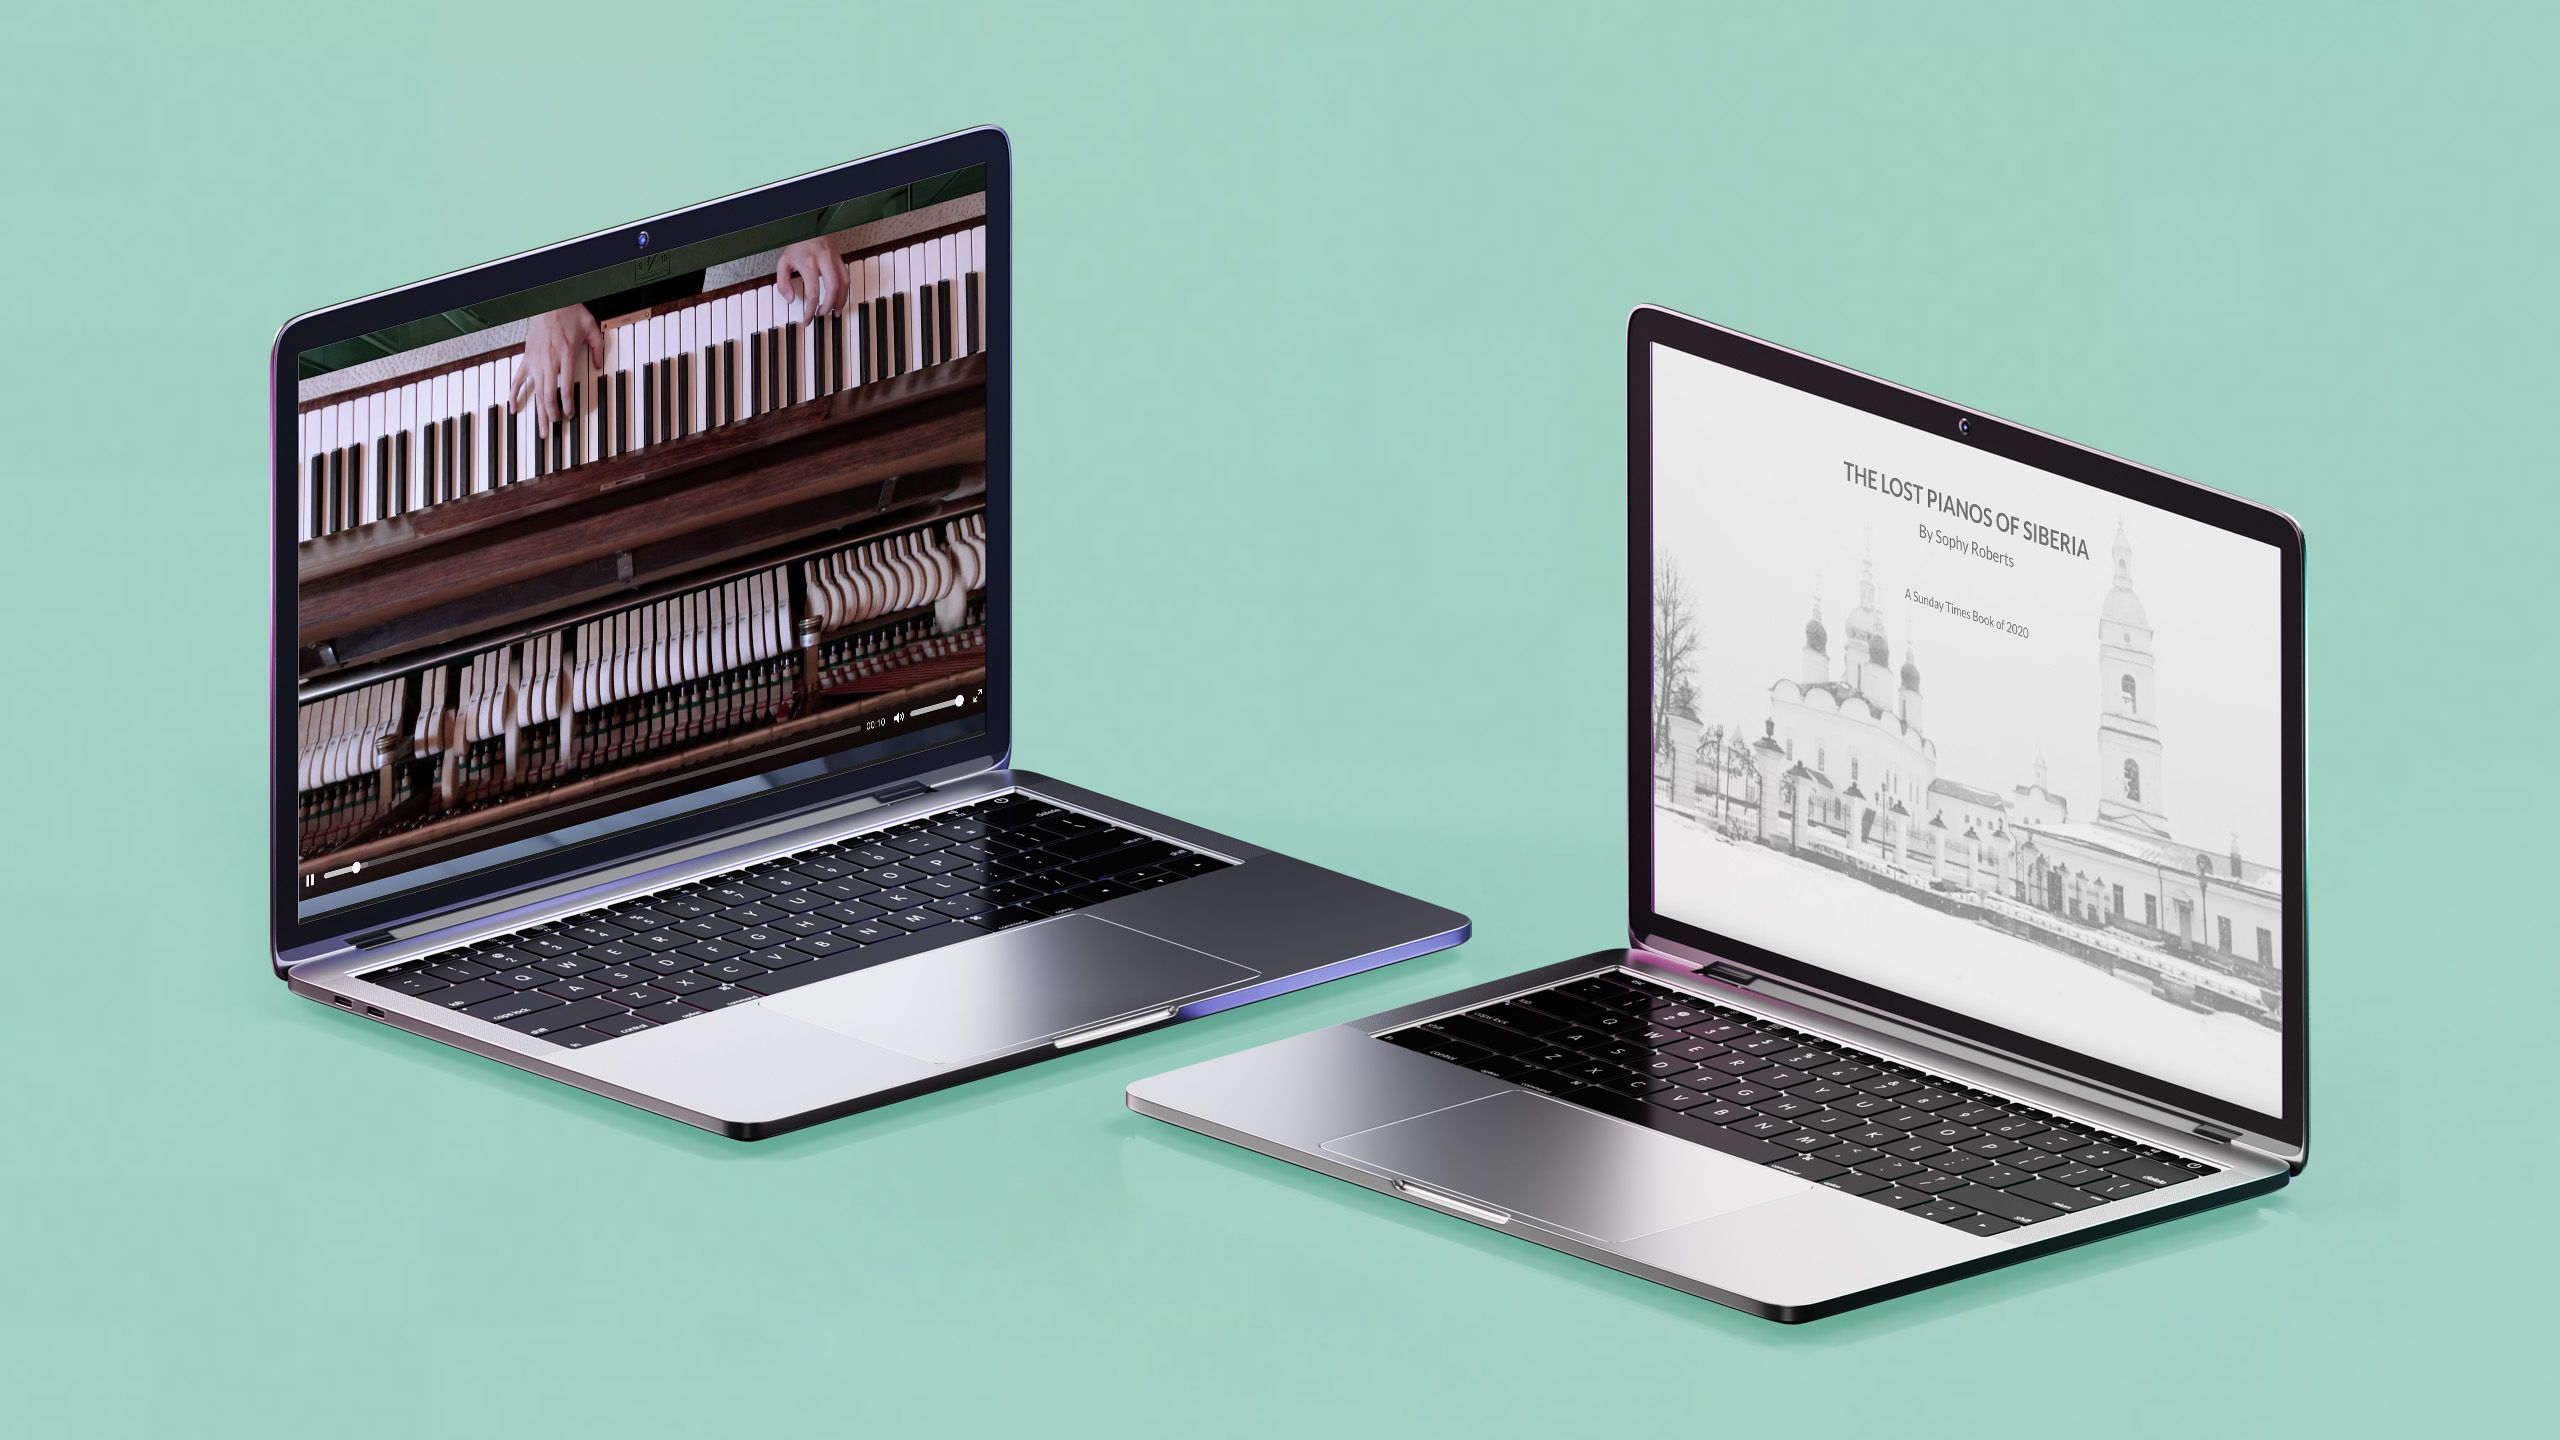
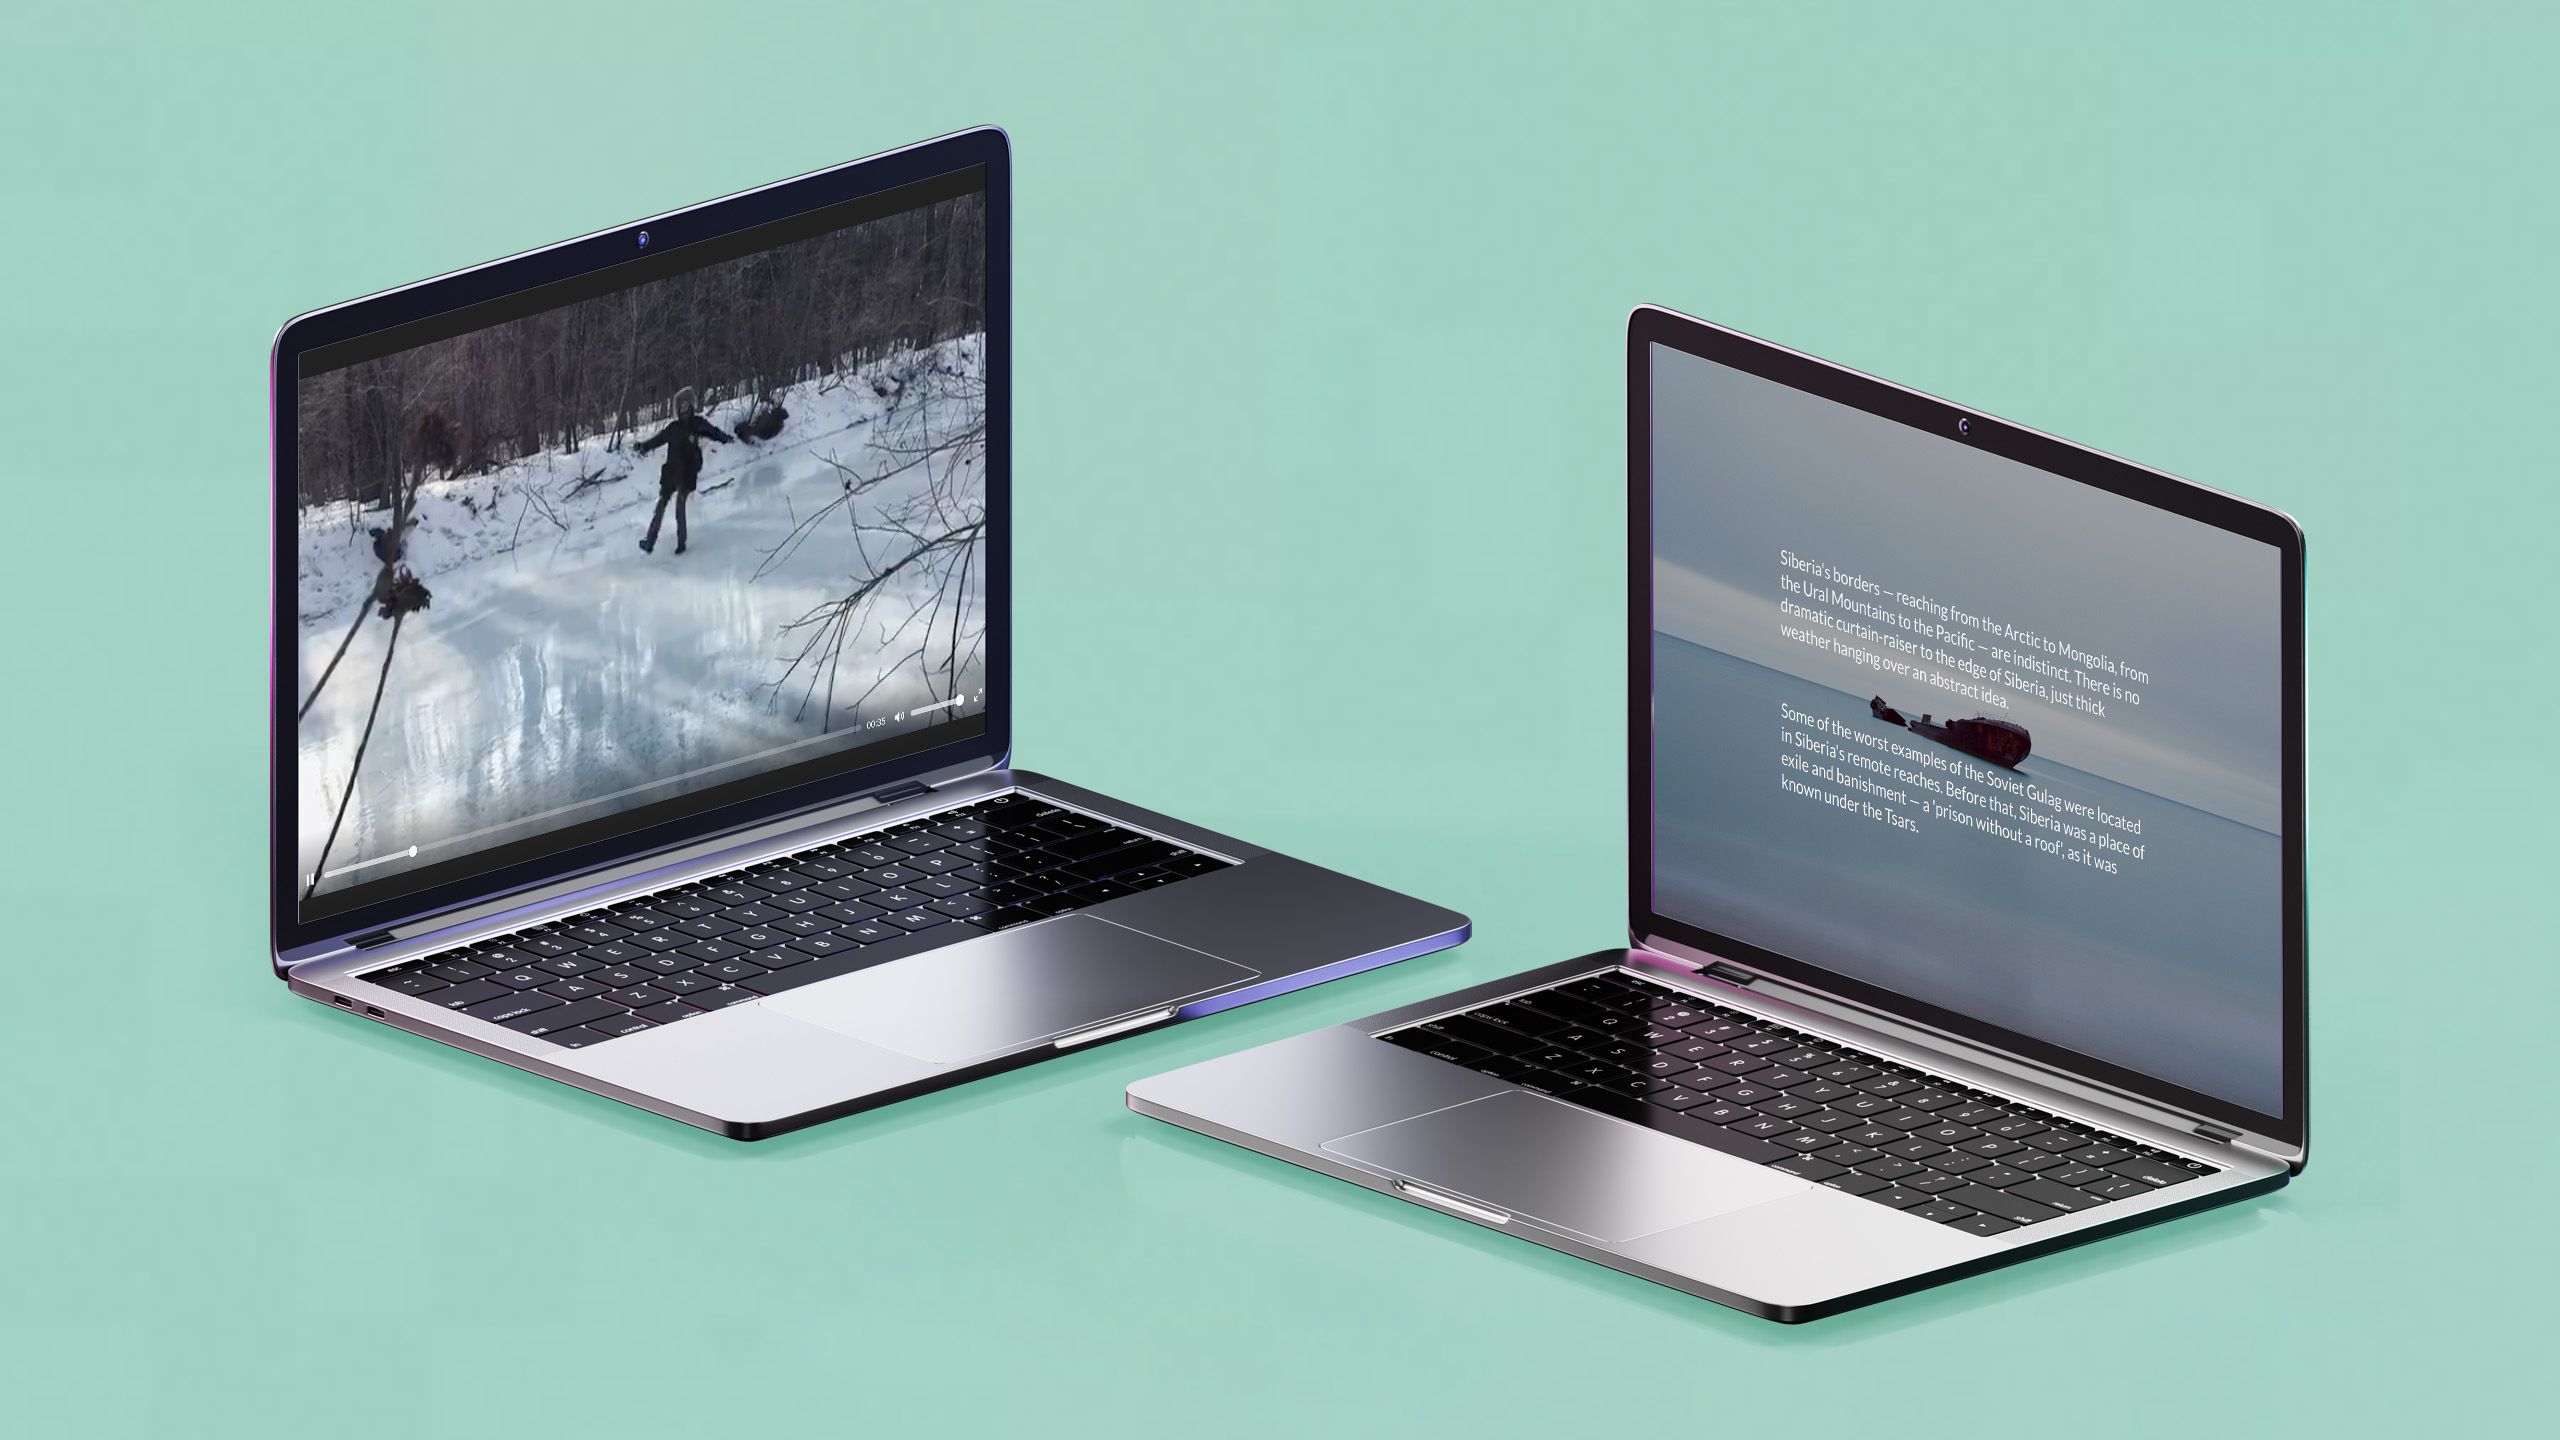
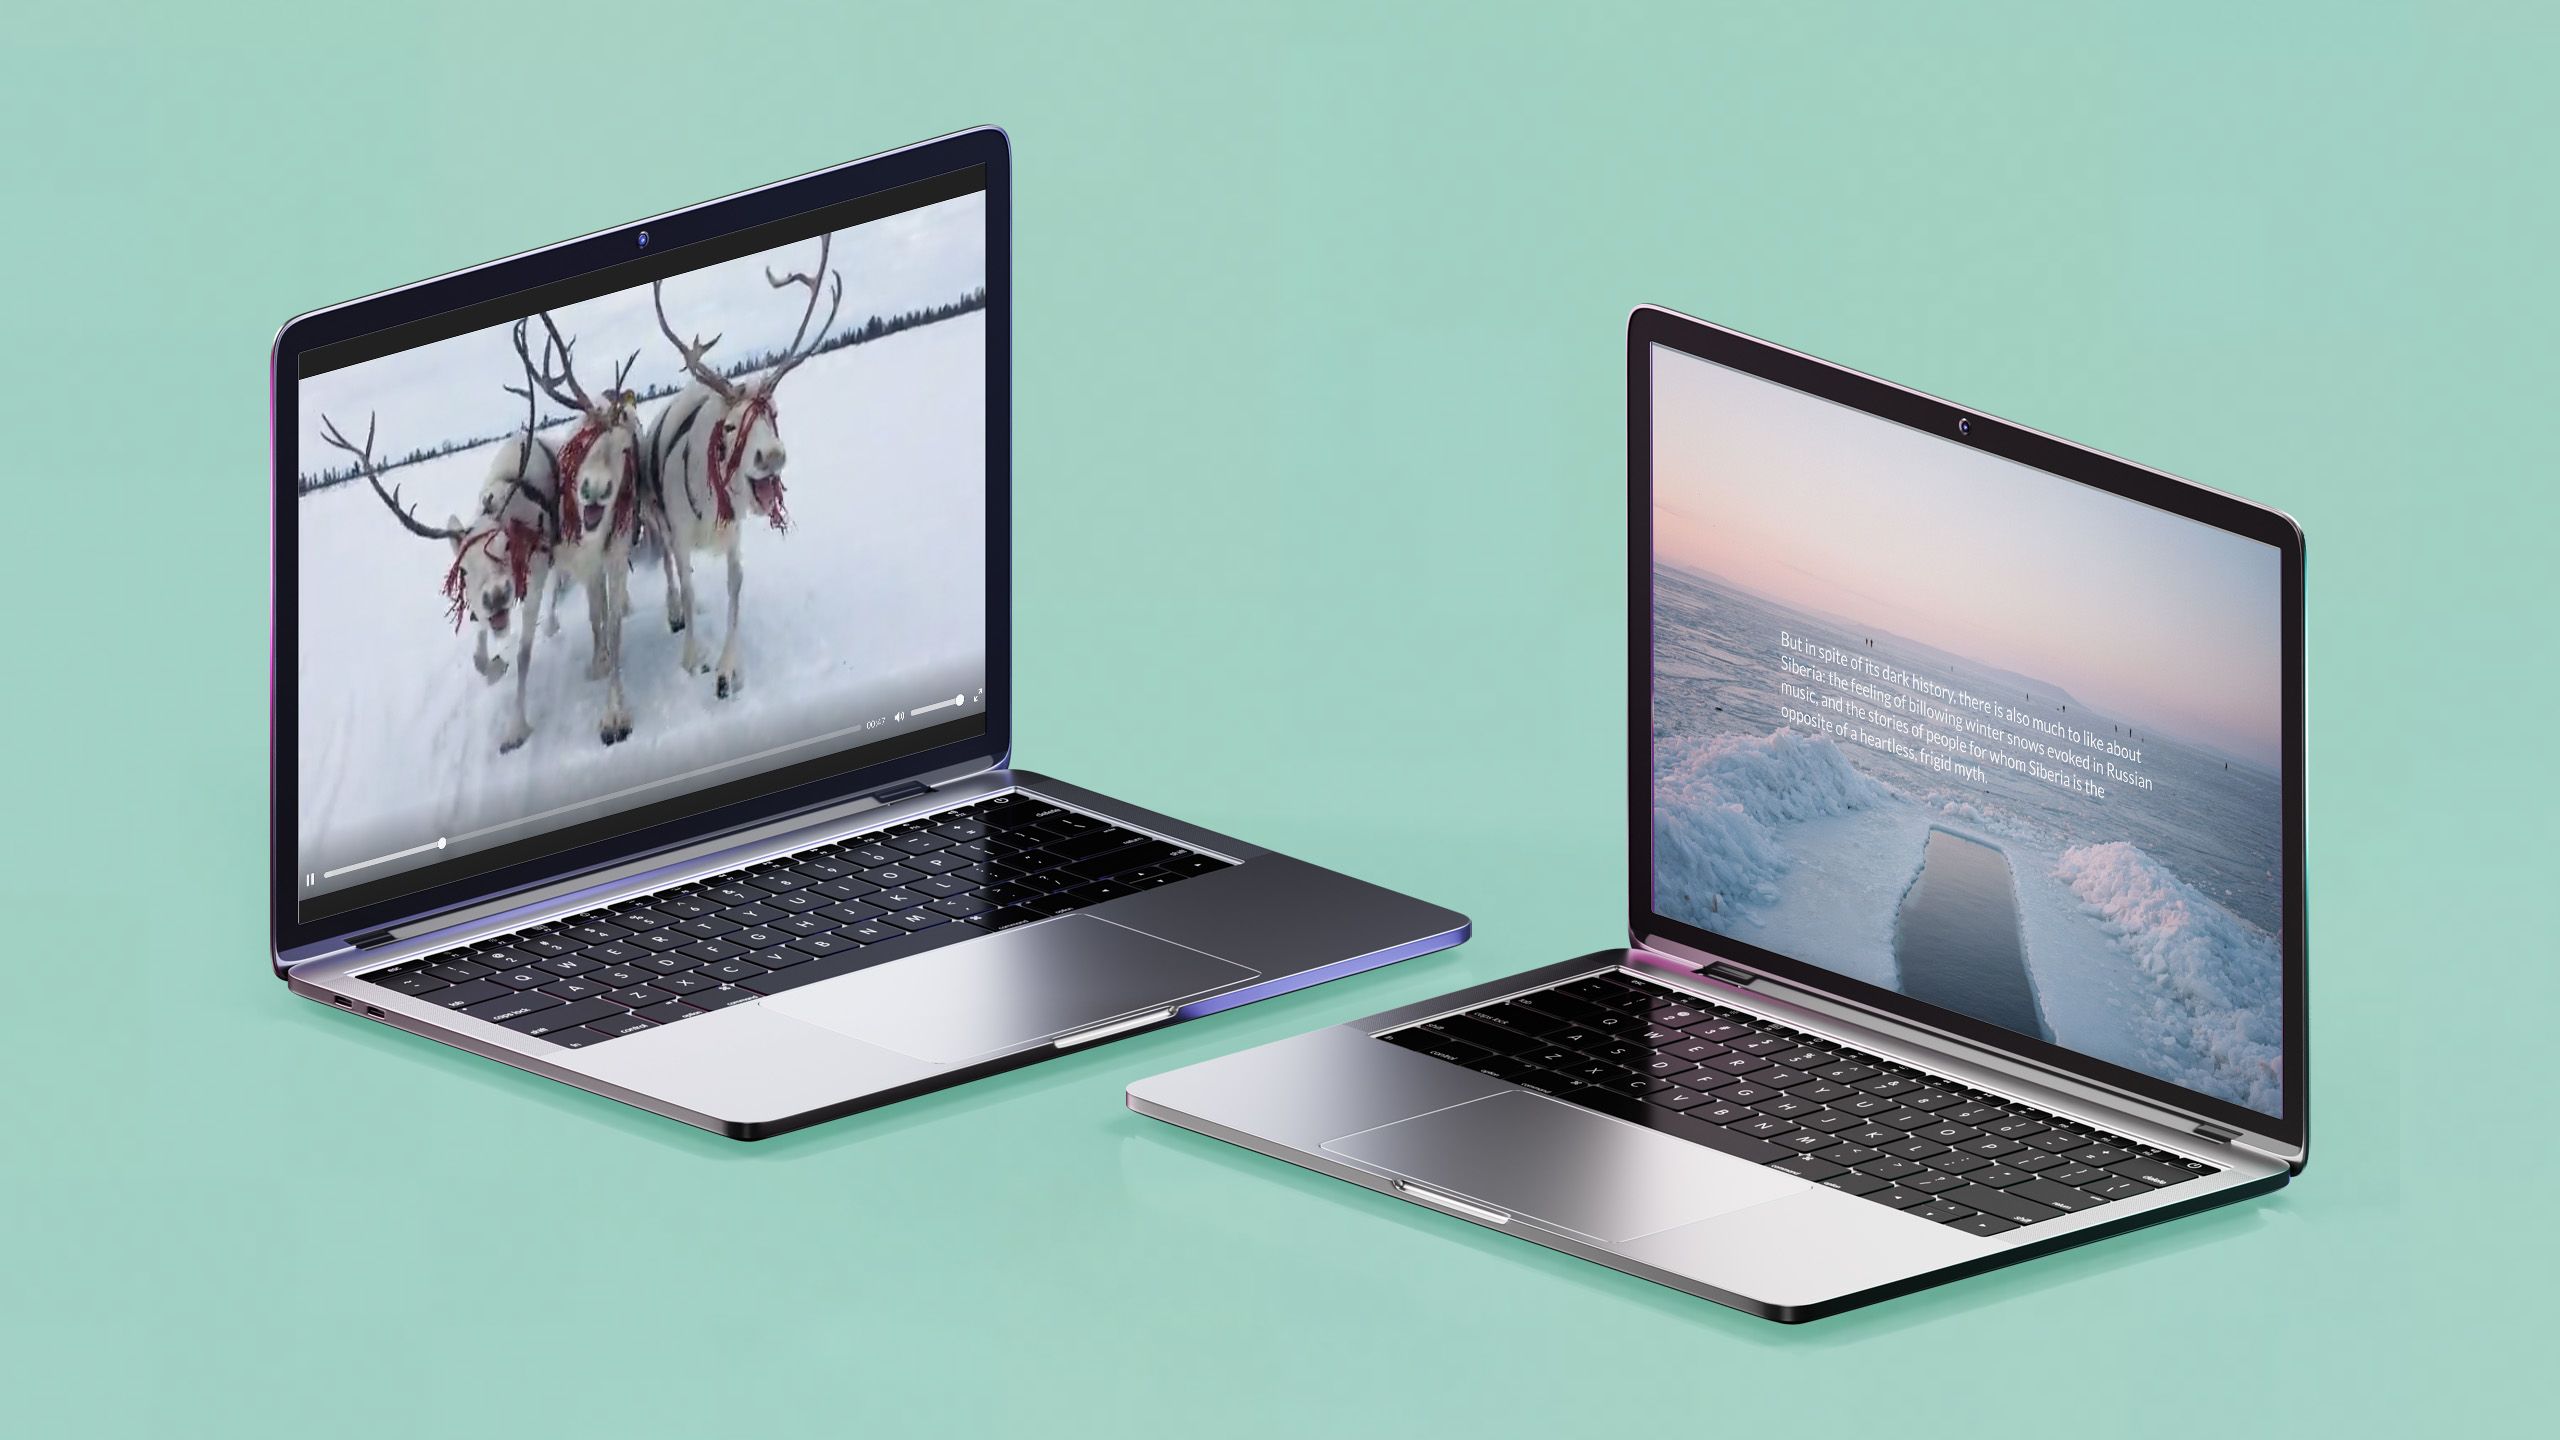
8. The Lost Pianos of Siberia
What it is: a promotional website for Sophy Roberts’ book of the same name.
Who created it: Sophy Roberts.
Why we picked this example:
Built as content marketing to promote Sophy Robert’s 2020 book, The Lost Pianos of Siberia, this website uses super compelling imagery to set the scene for the book’s story and offer background details meant to hook readers. The photographs and videos perfectly evoke what most of us think of when we hear “Siberia,” while beautiful piano music plays across multiple videos.


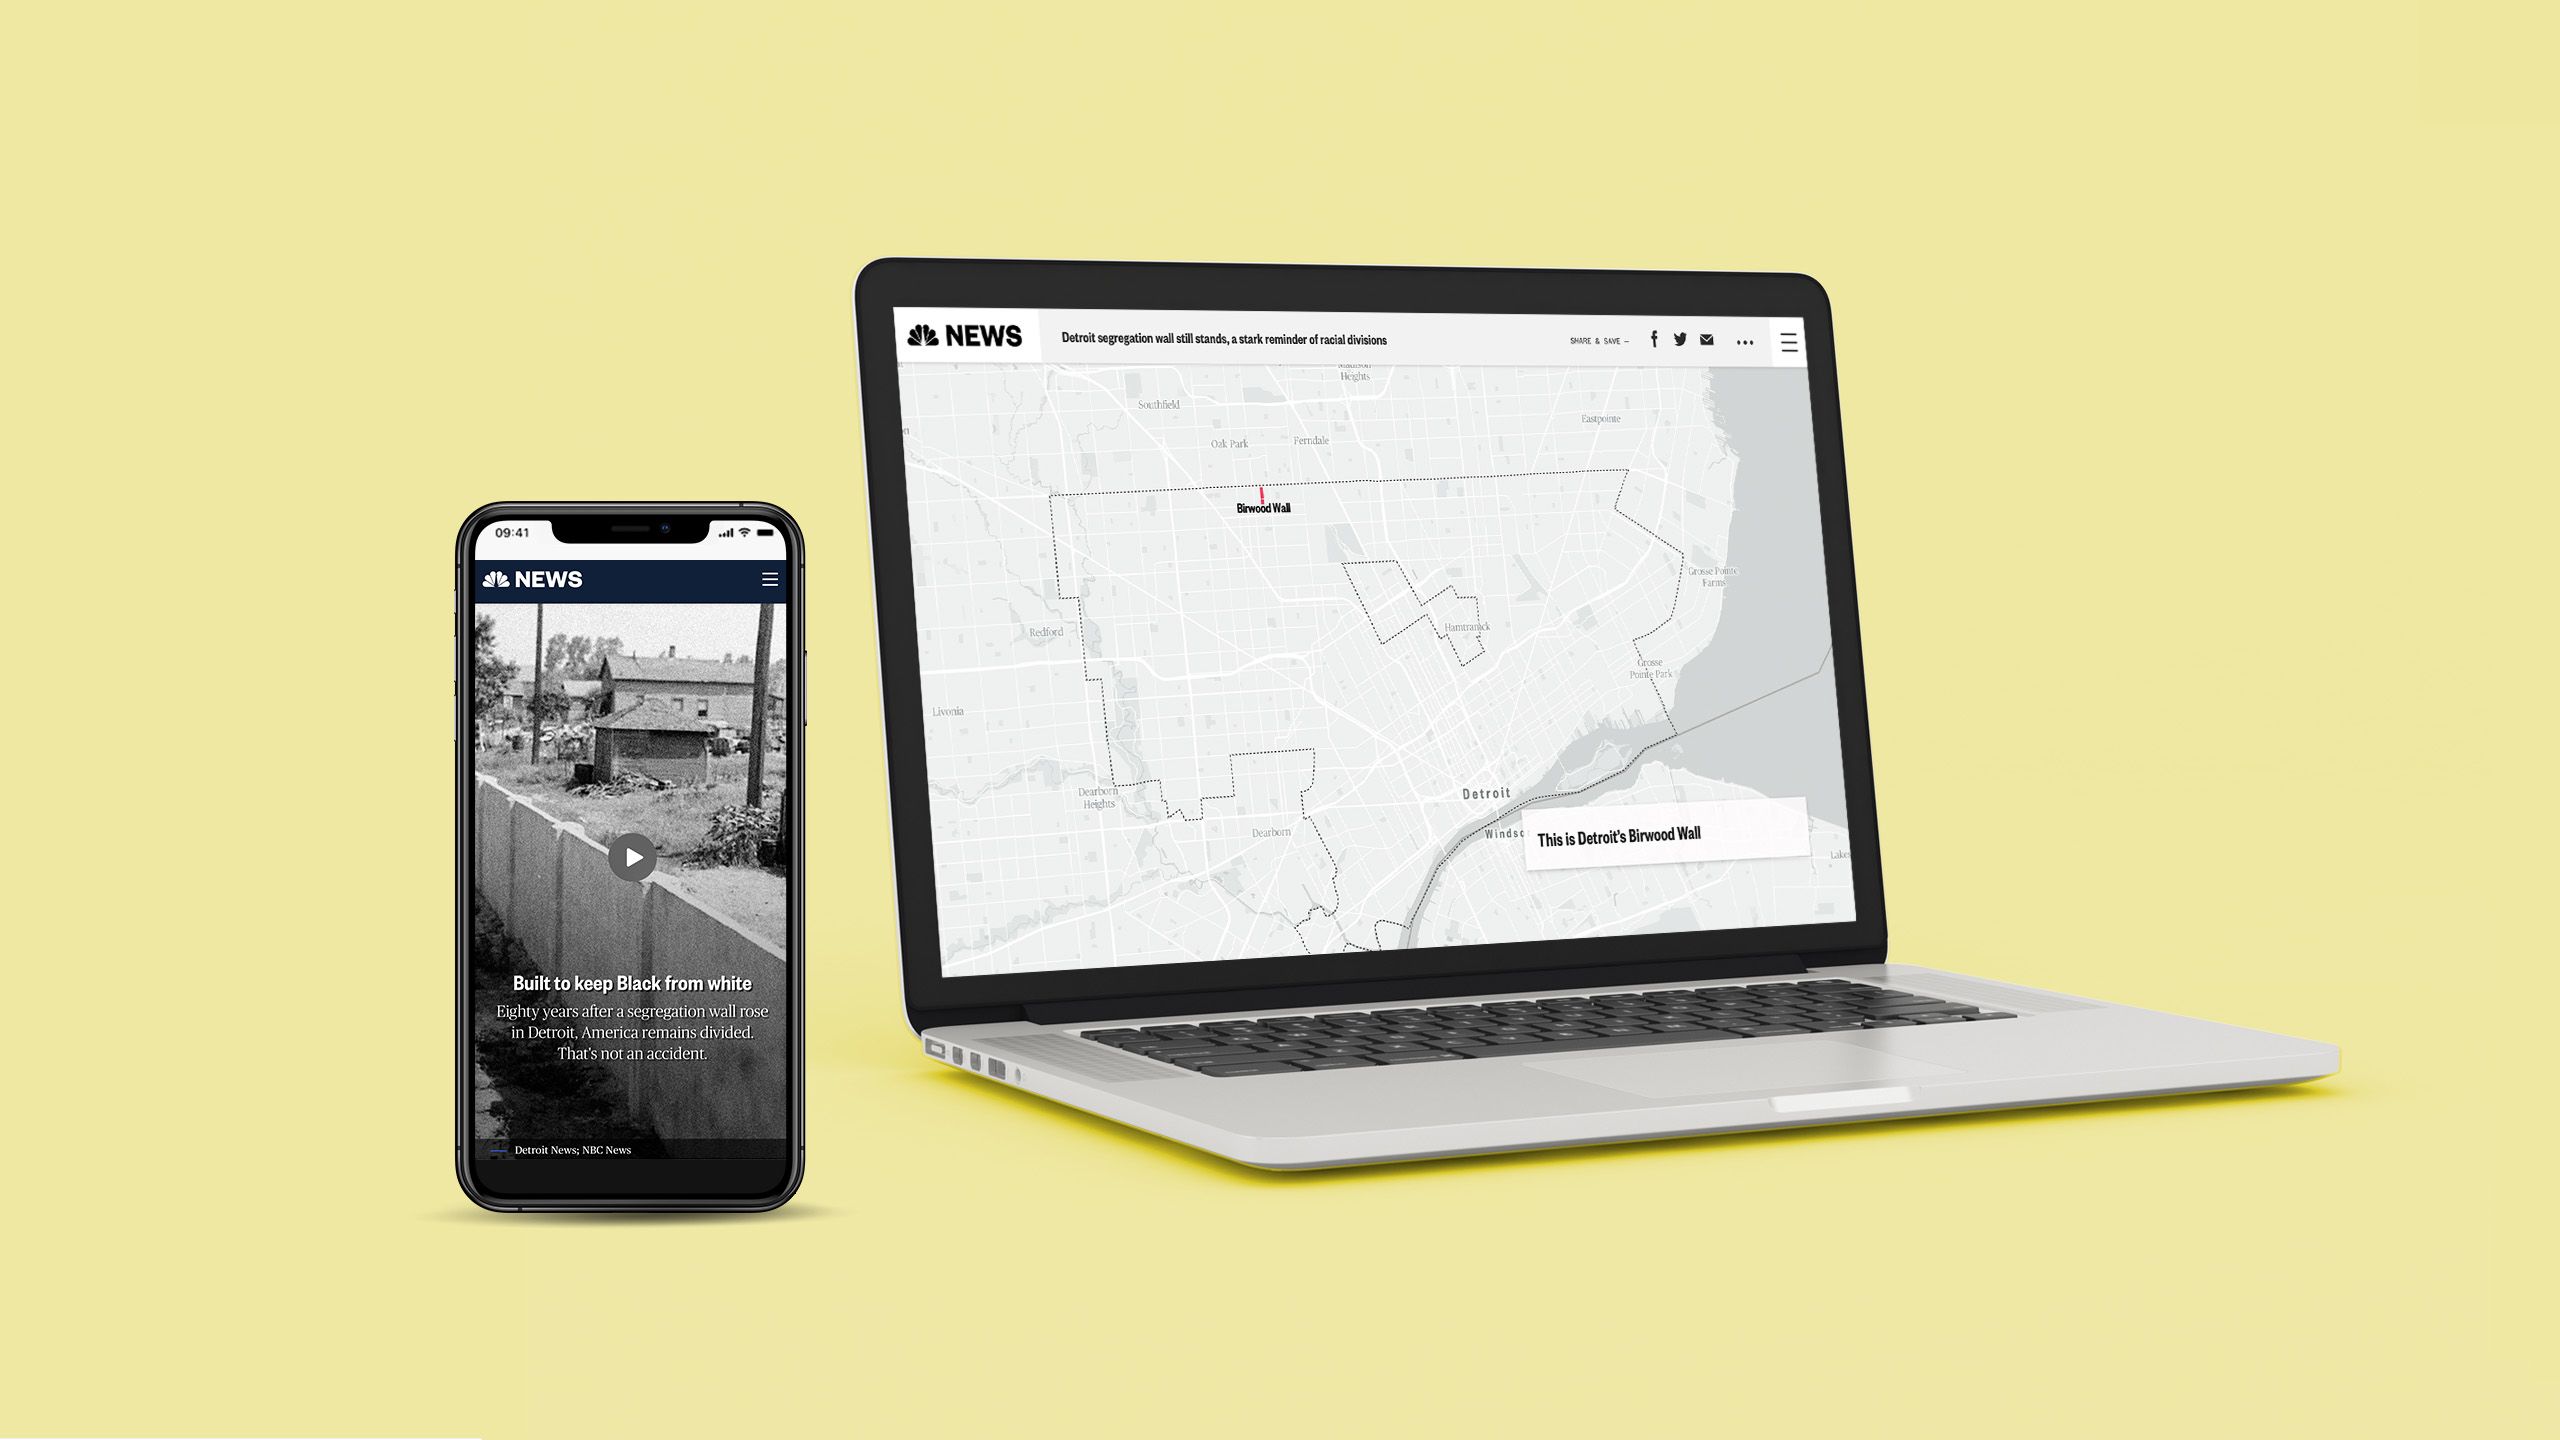
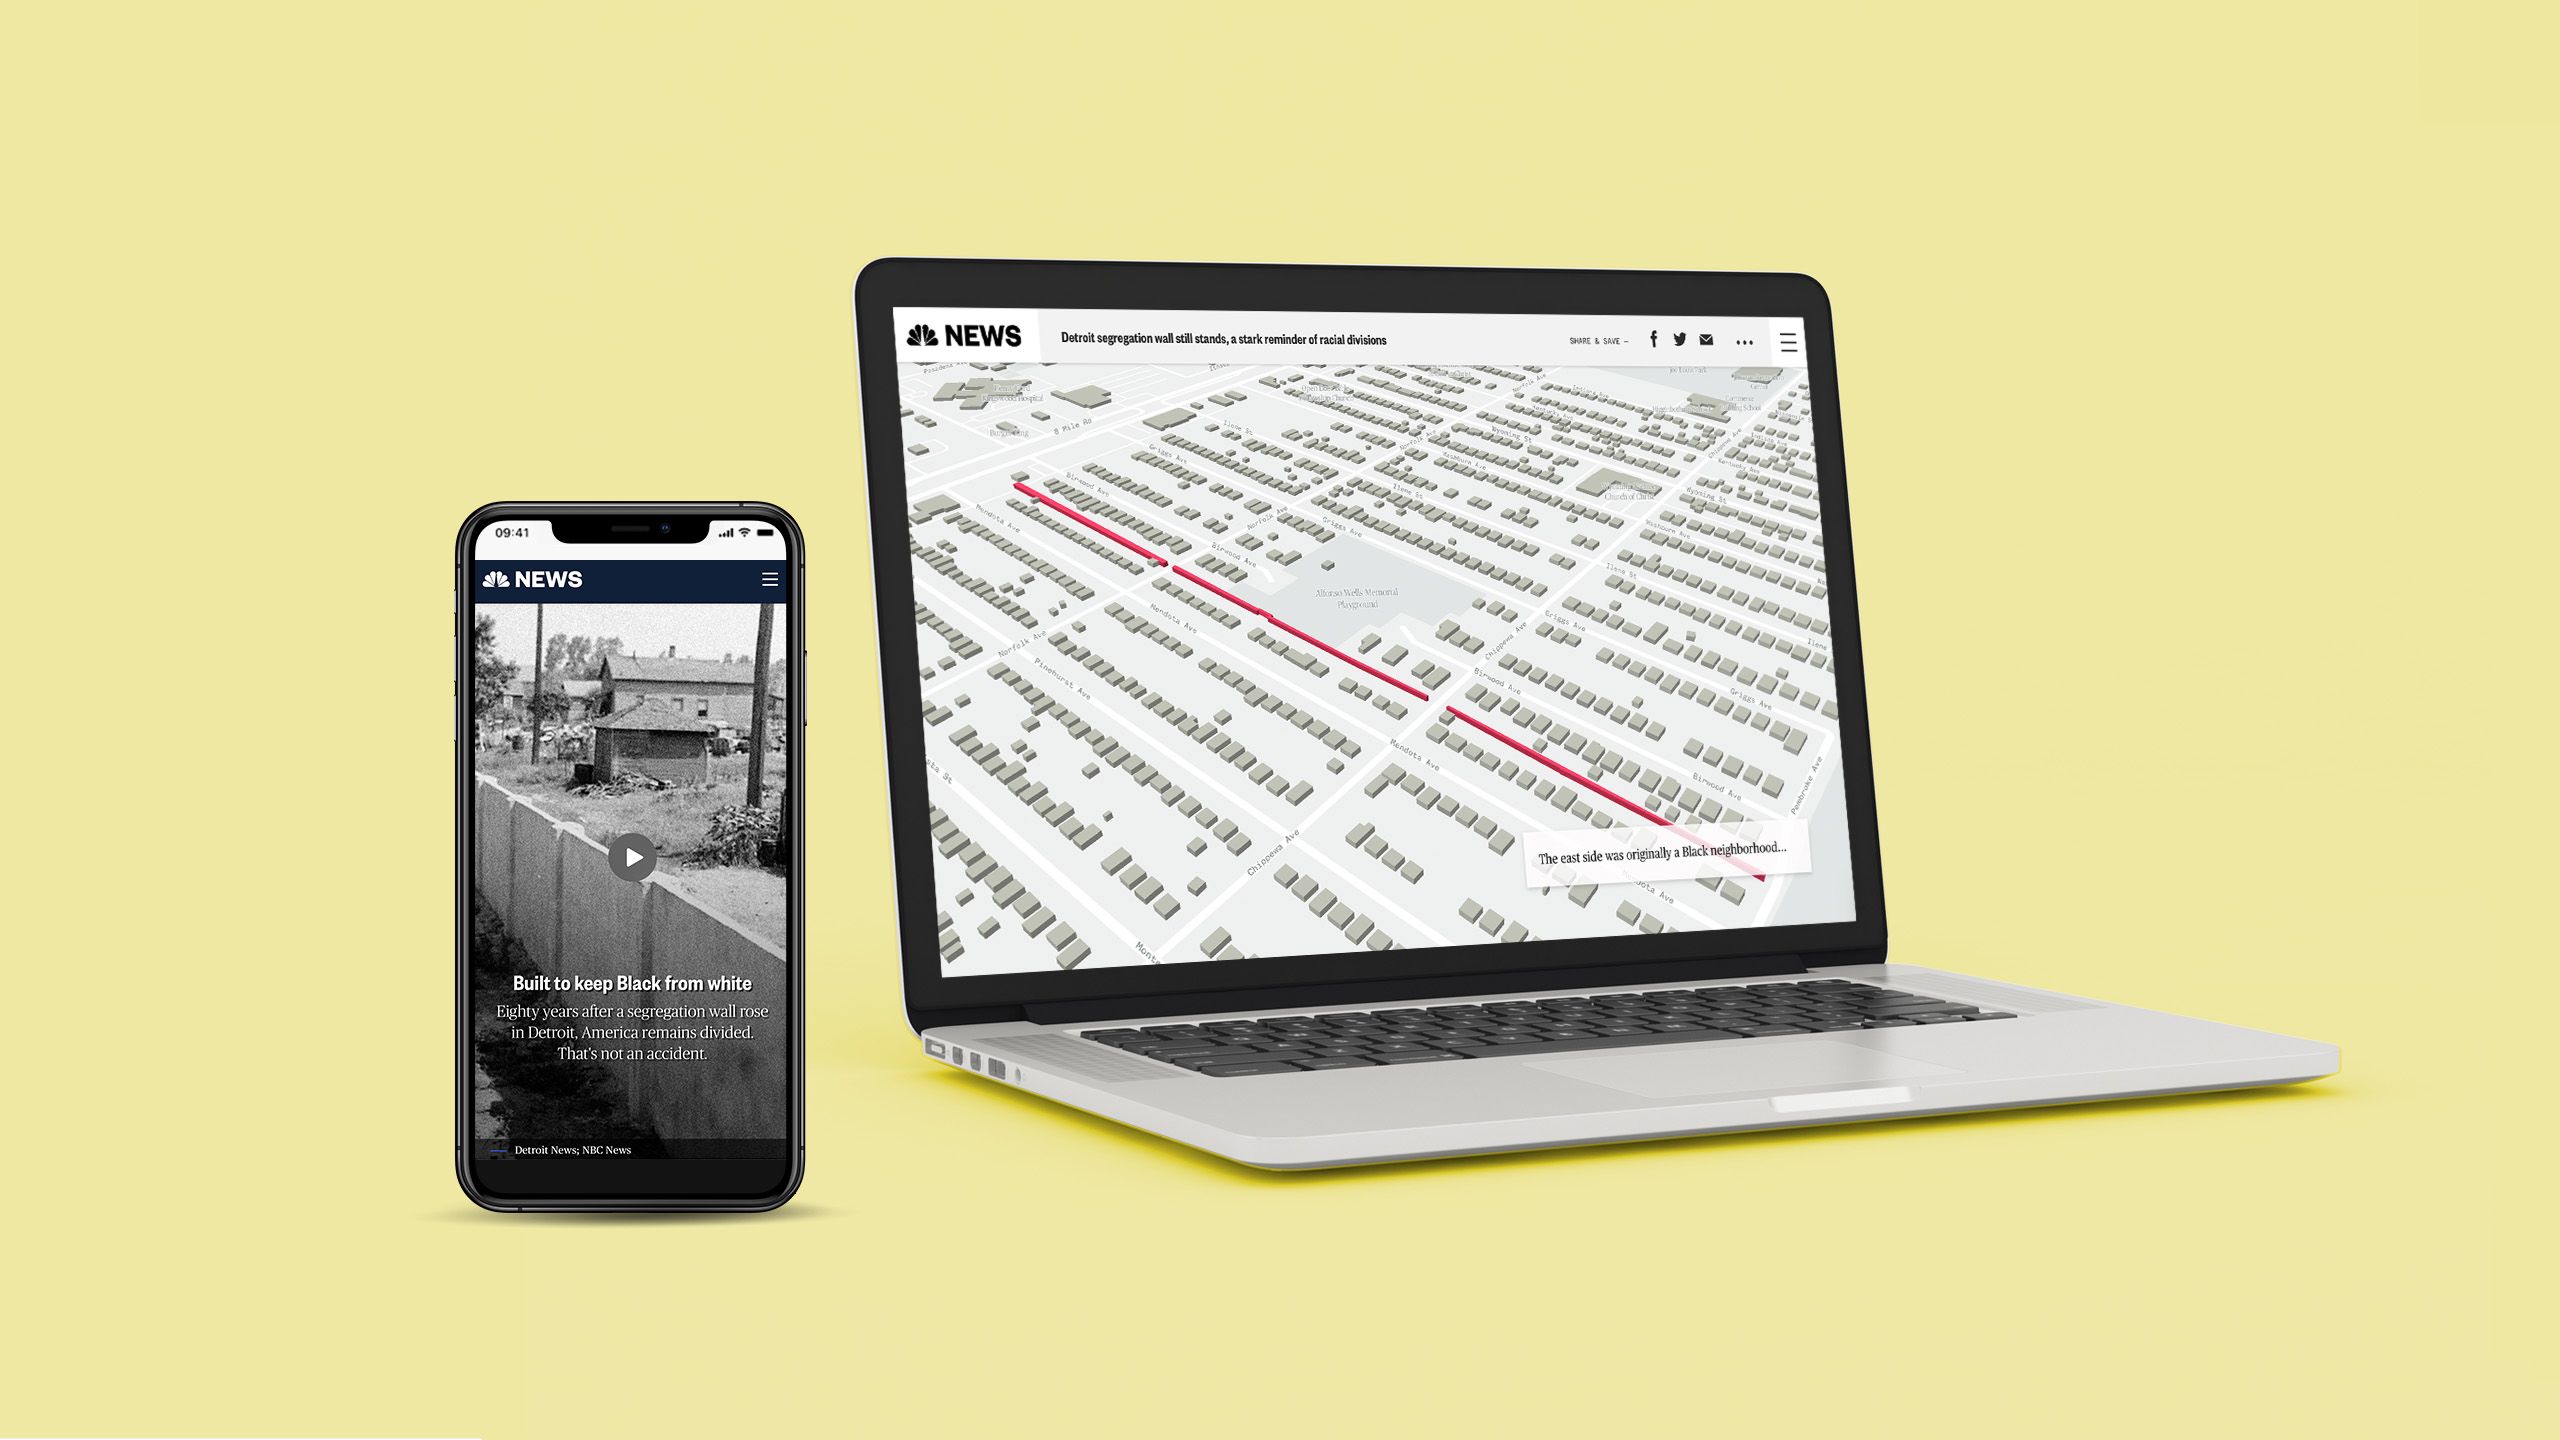
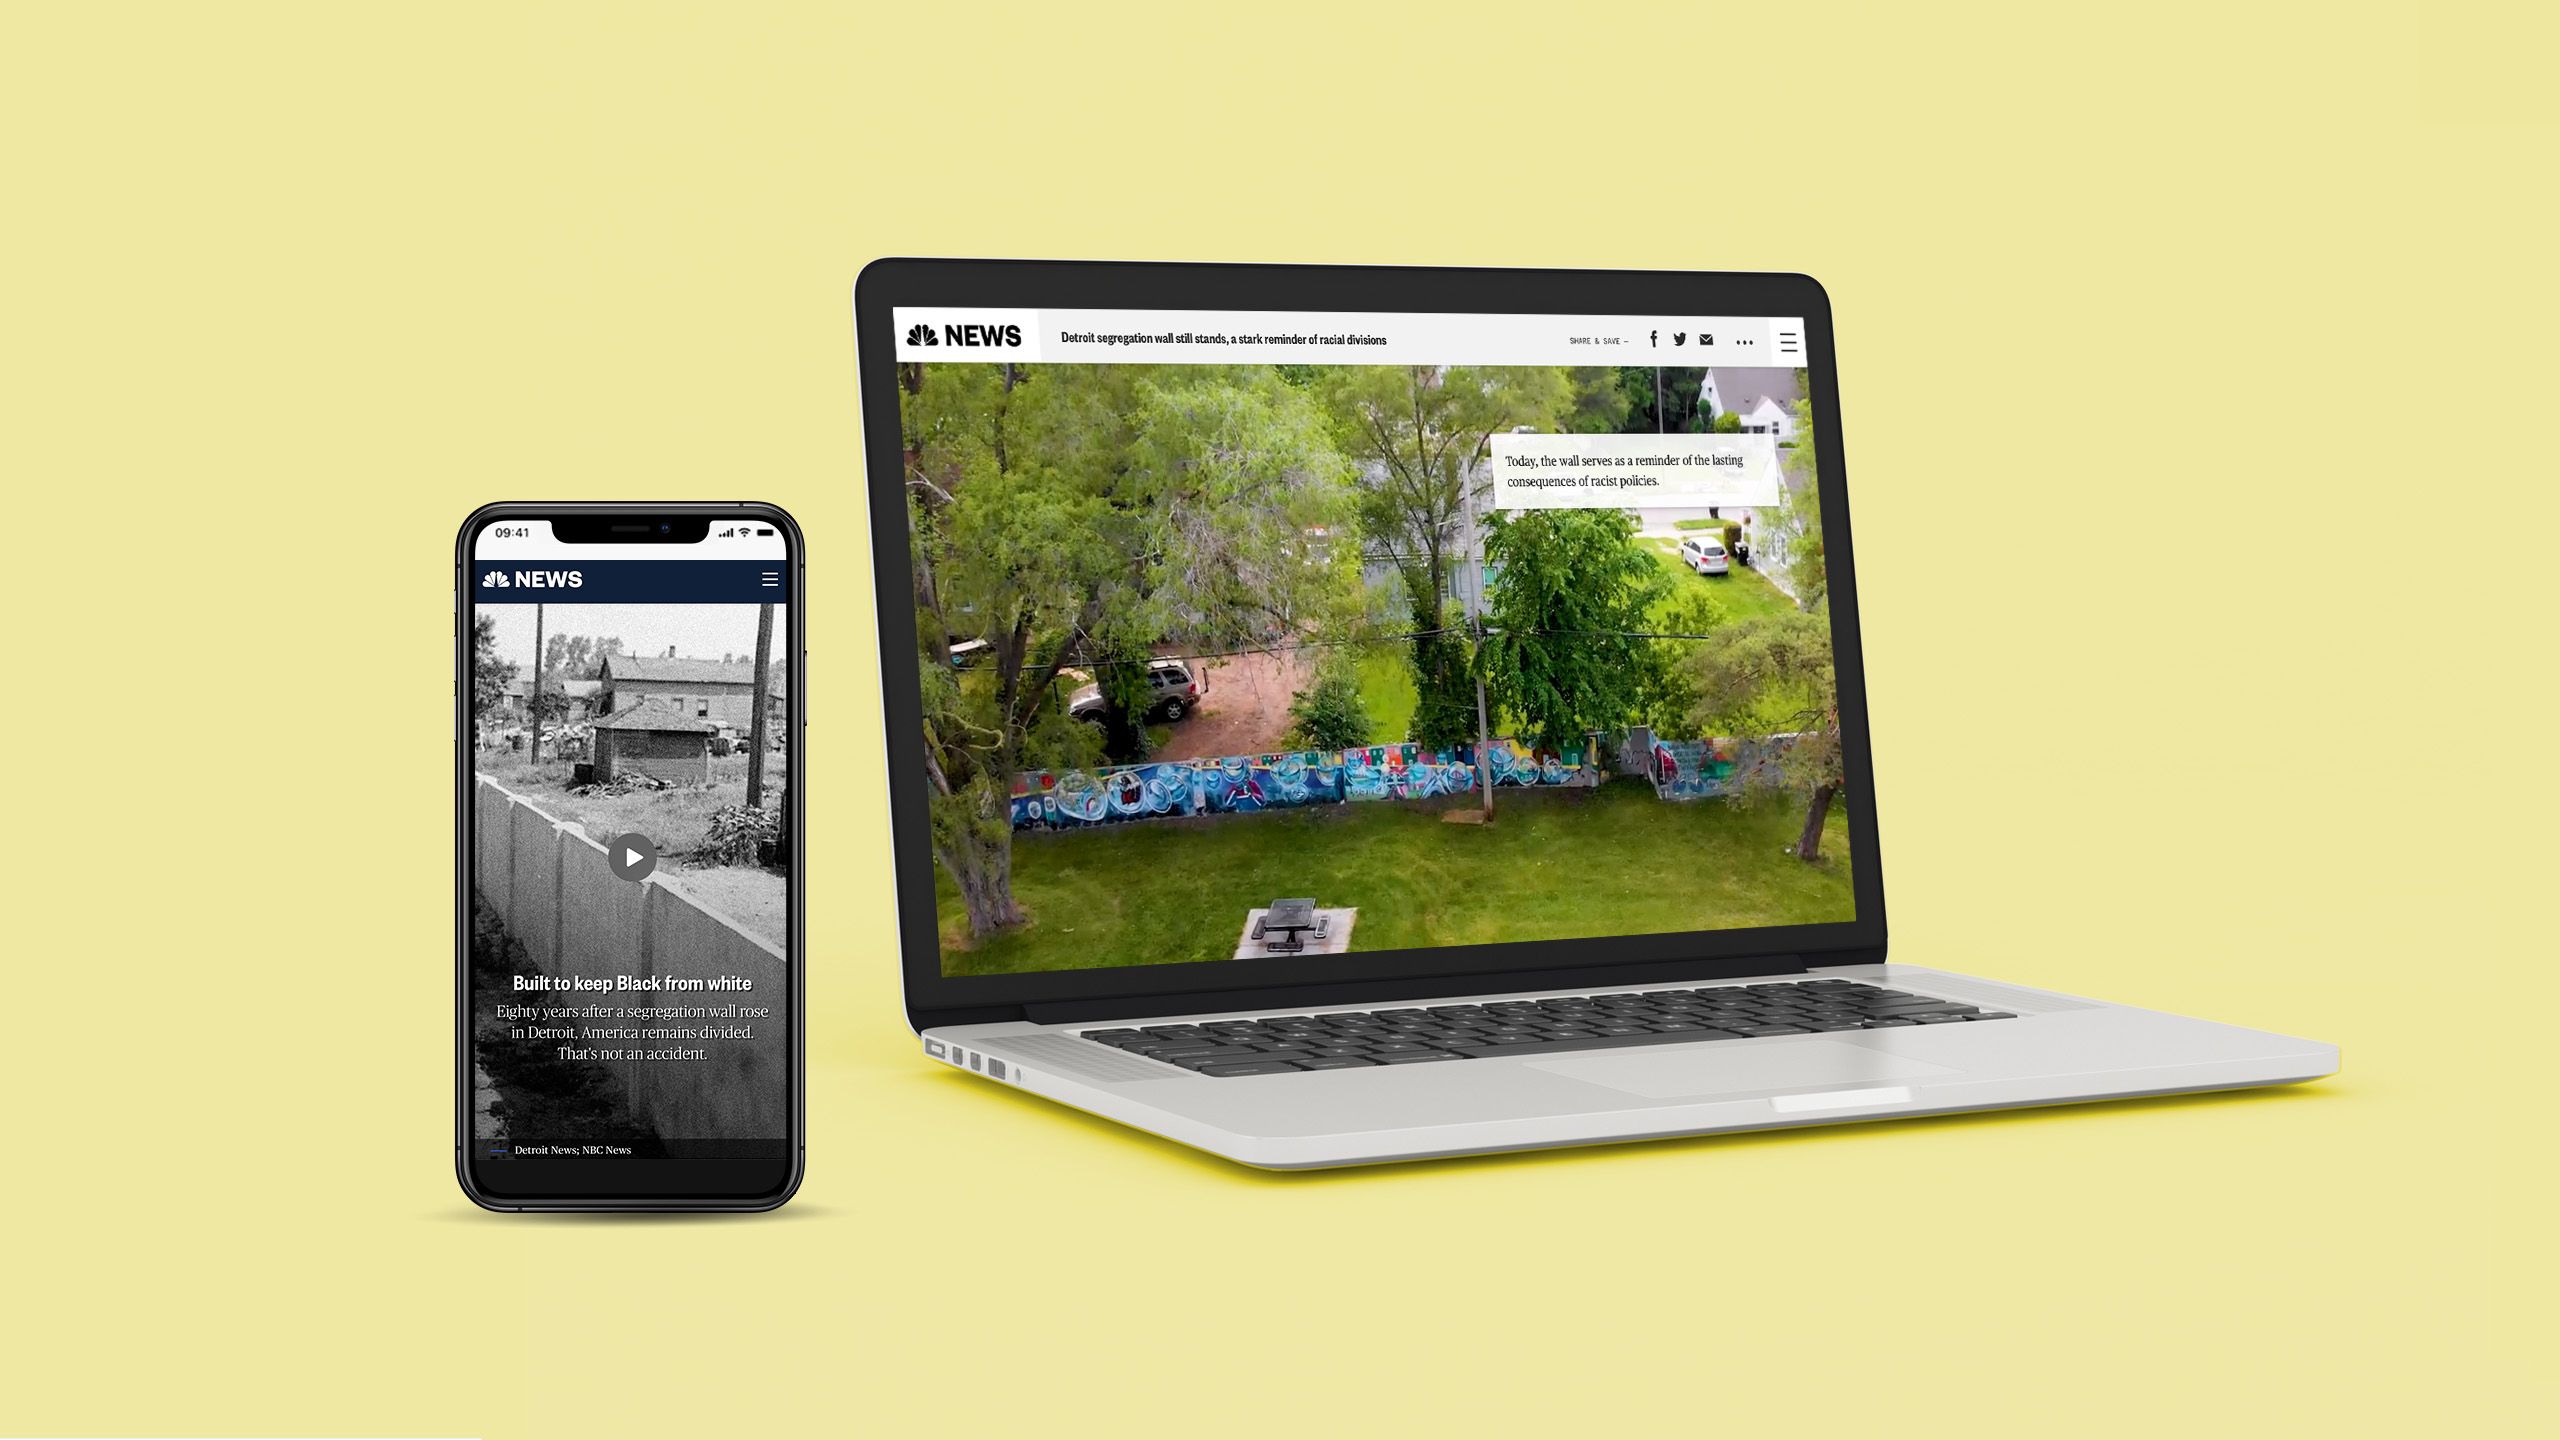
9. Built to keep Black from white
What it is: an editorial on the history of segregation in America and its legacy today.
Who created it: NBC News.
Why we picked this example:
This editorial report — which won a Webby Award for Best Individual Editorial Feature — is one of our absolute favourite examples of using interactive maps to tell a story. While the story also features text, other images, and video content, it’s the maps that really hammer home the reality and lasting legacy of racial segregation in Detroit.


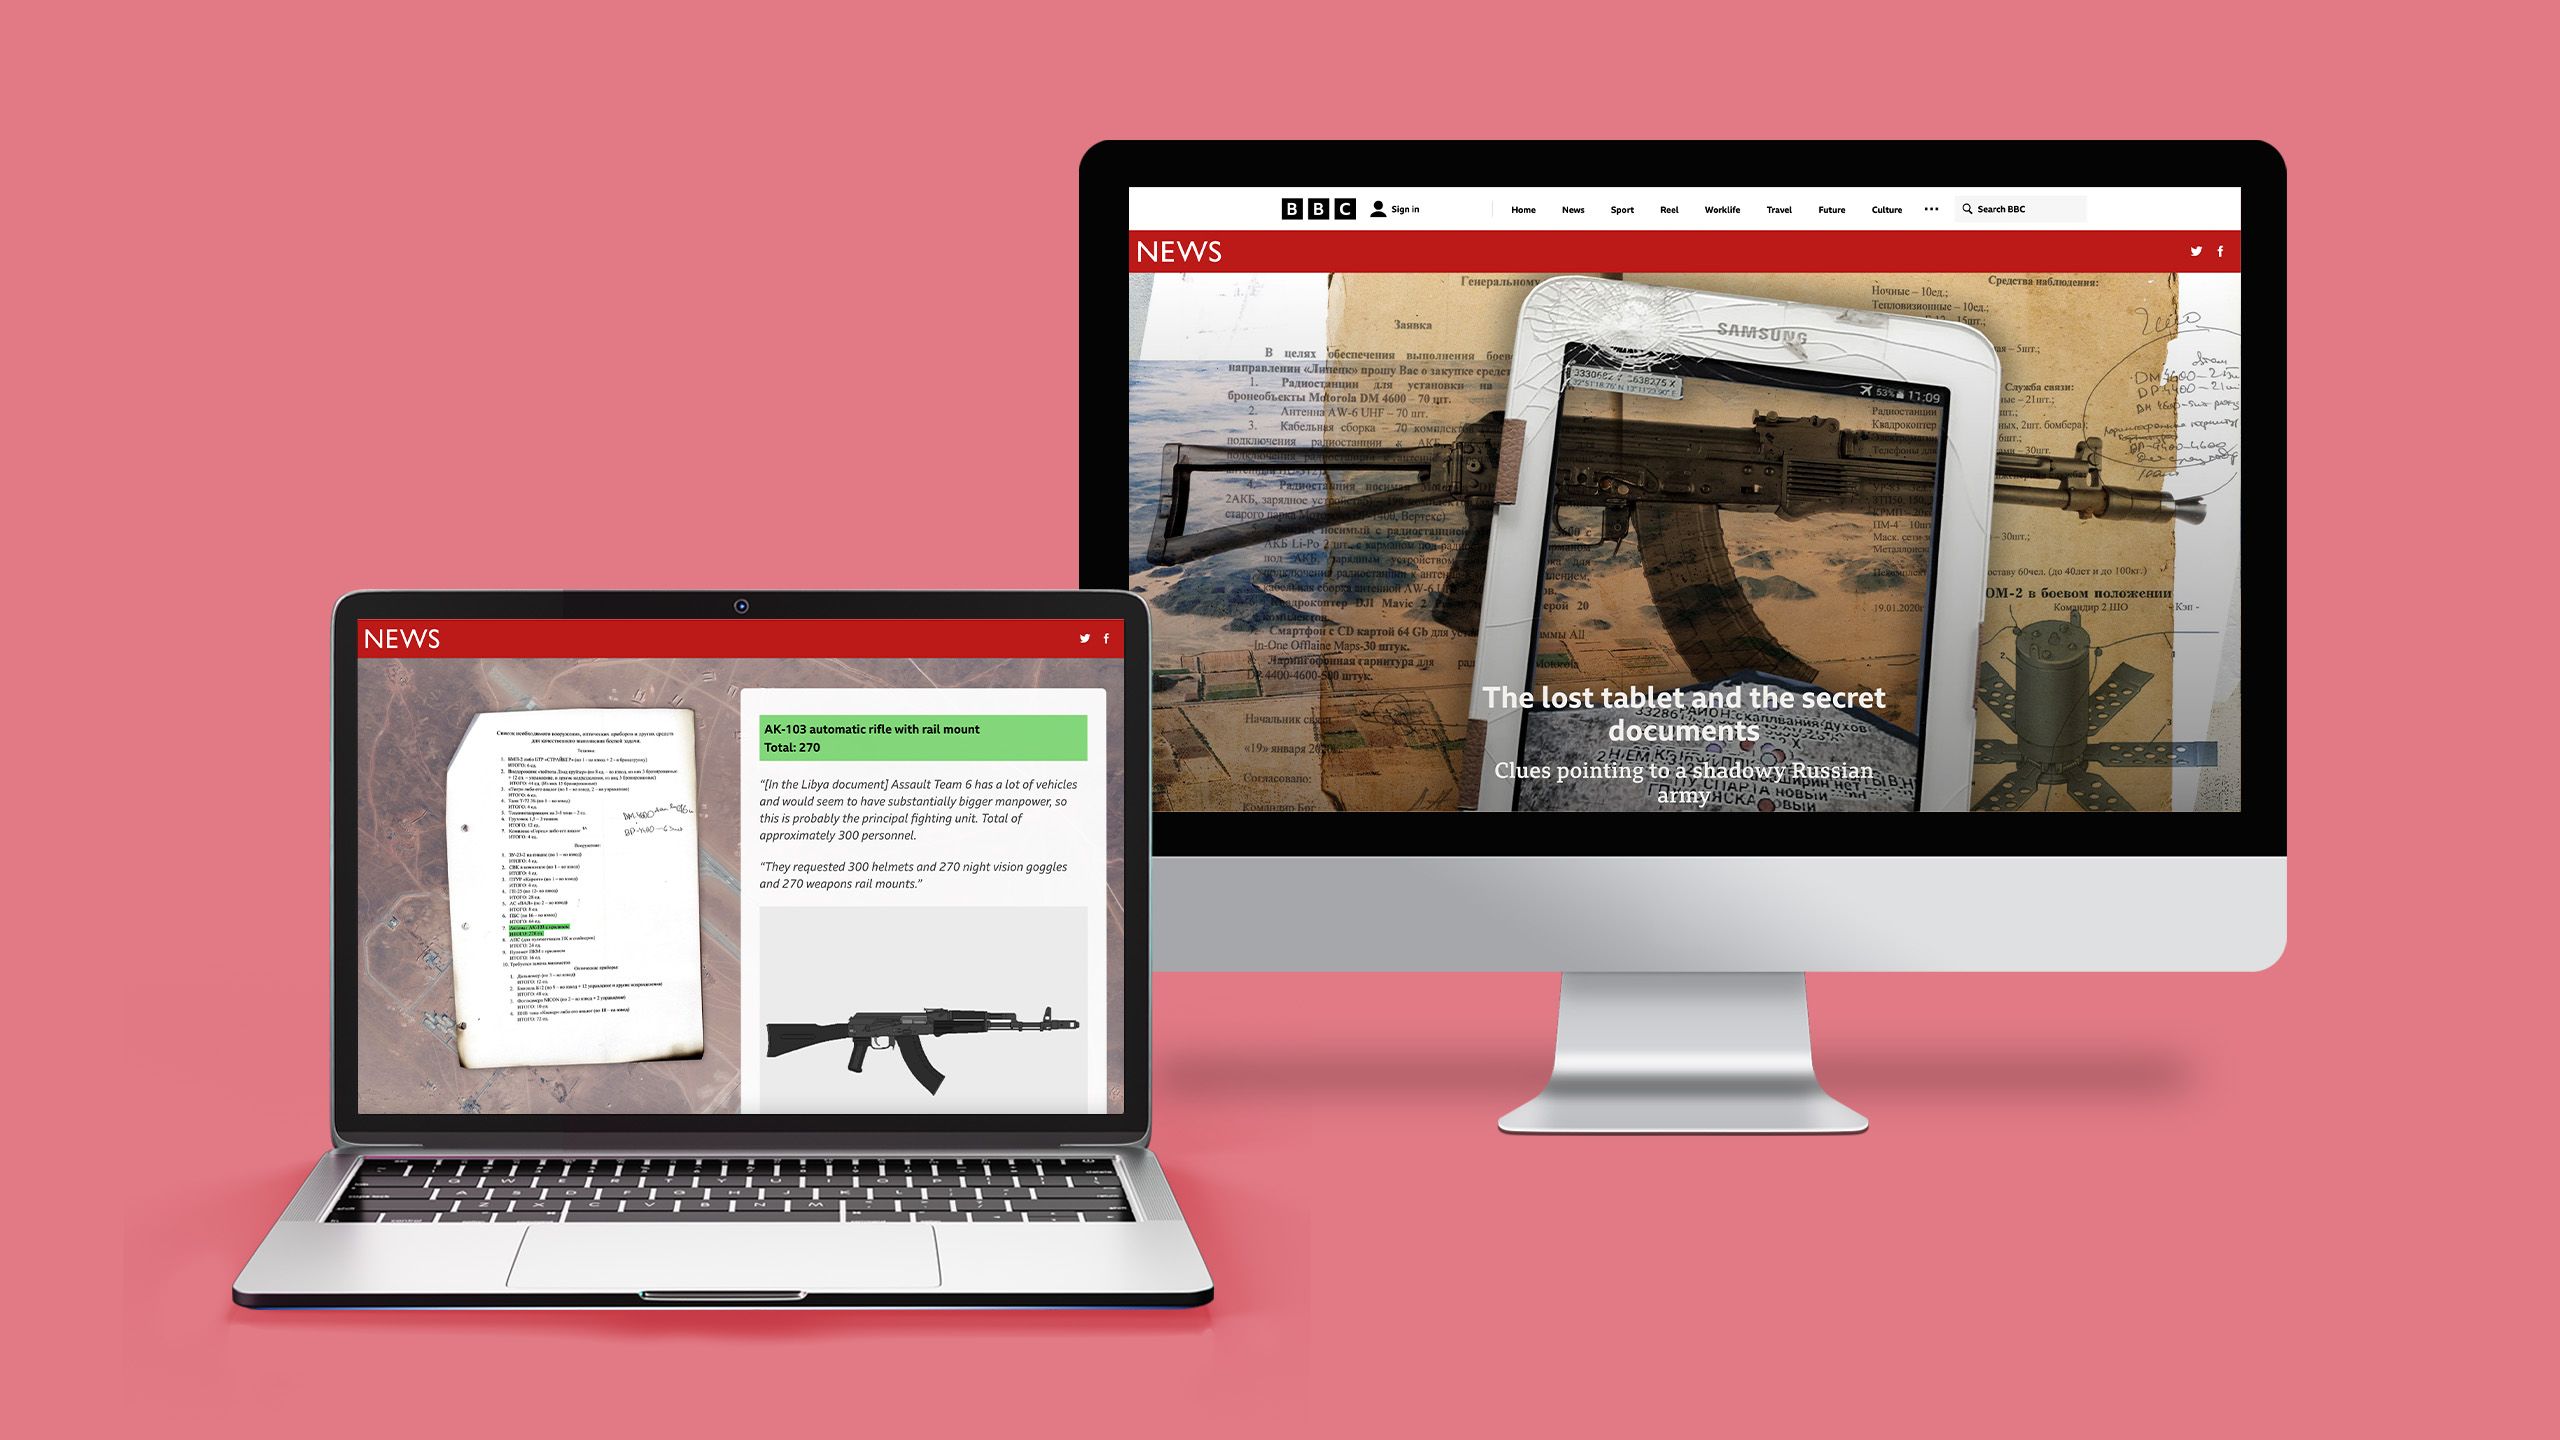
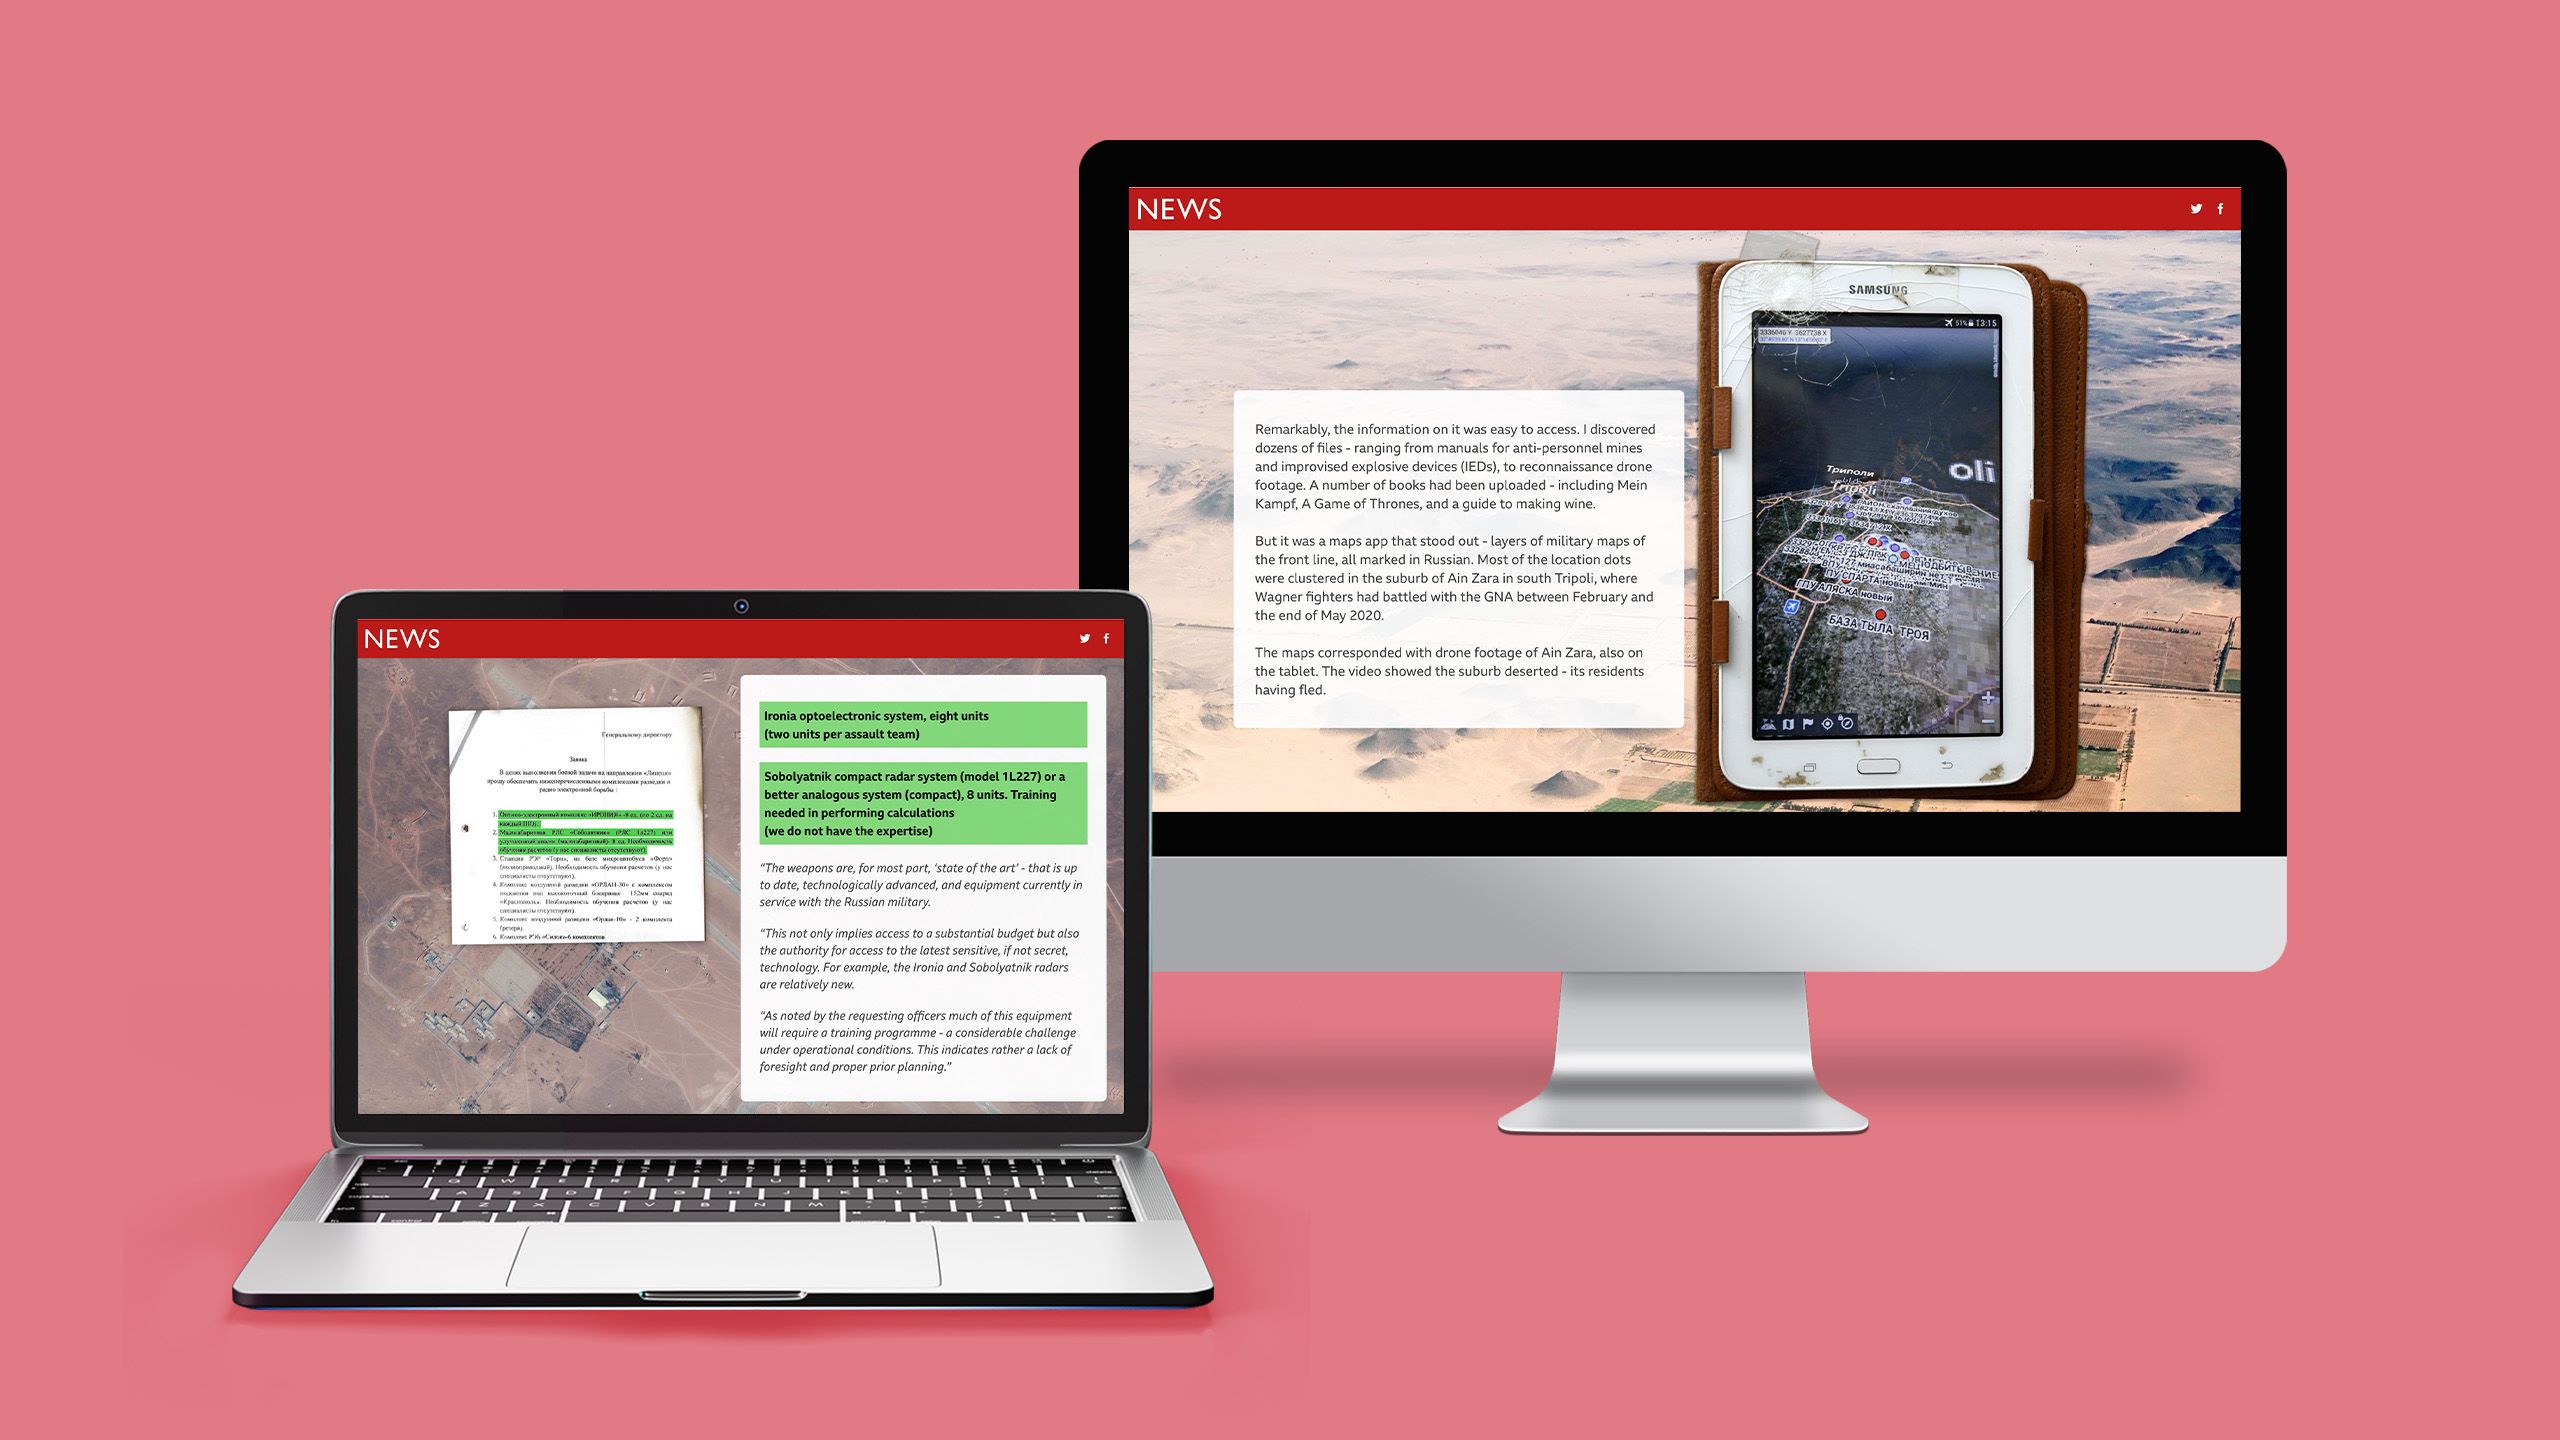
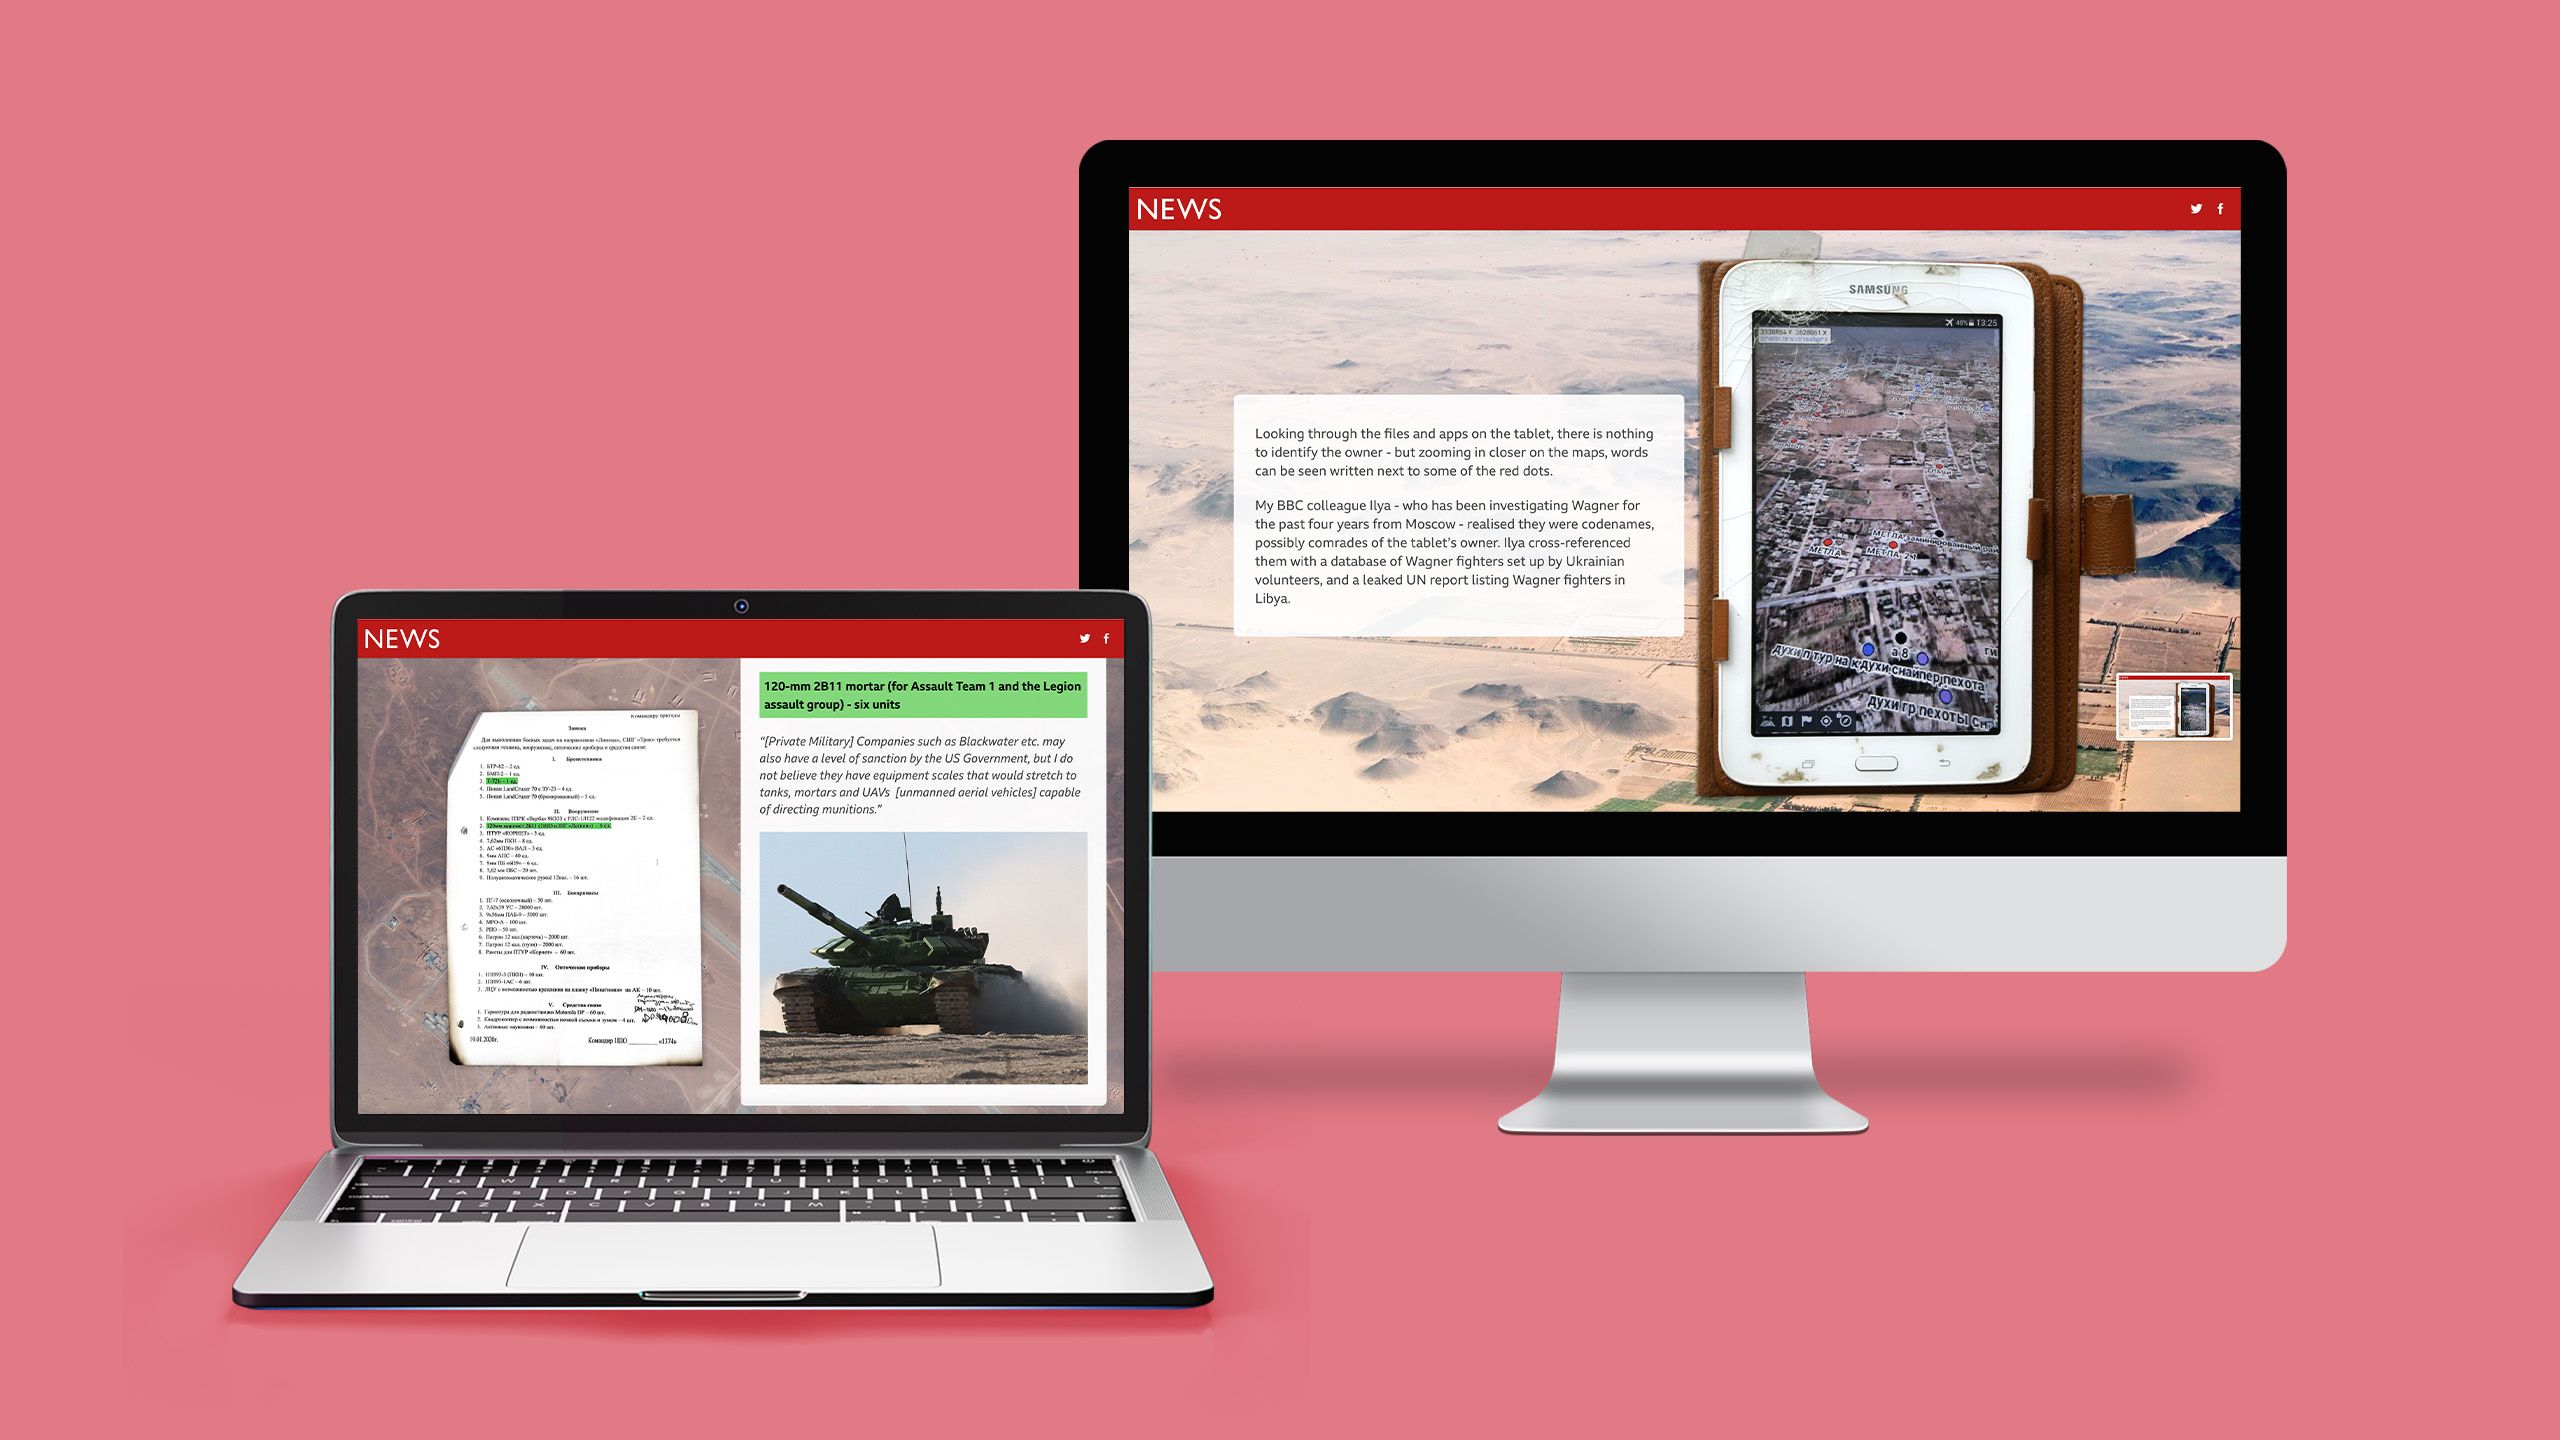
10. The lost tablet and the secret documents
What it is: a report on a secretive Russian mercenary group.
Who created it: BBC.
Why we picked this example:
A lost tablet from a shadowy Russian mercenary group found abandoned in Libya? That’s a story, and the BBC doesn’t hold back in their report on the tablet’s contents. The report pulls in screenshots from the tablet’s maps app, photos and drone footage found on the tablet, even a “shopping list” for military equipment.


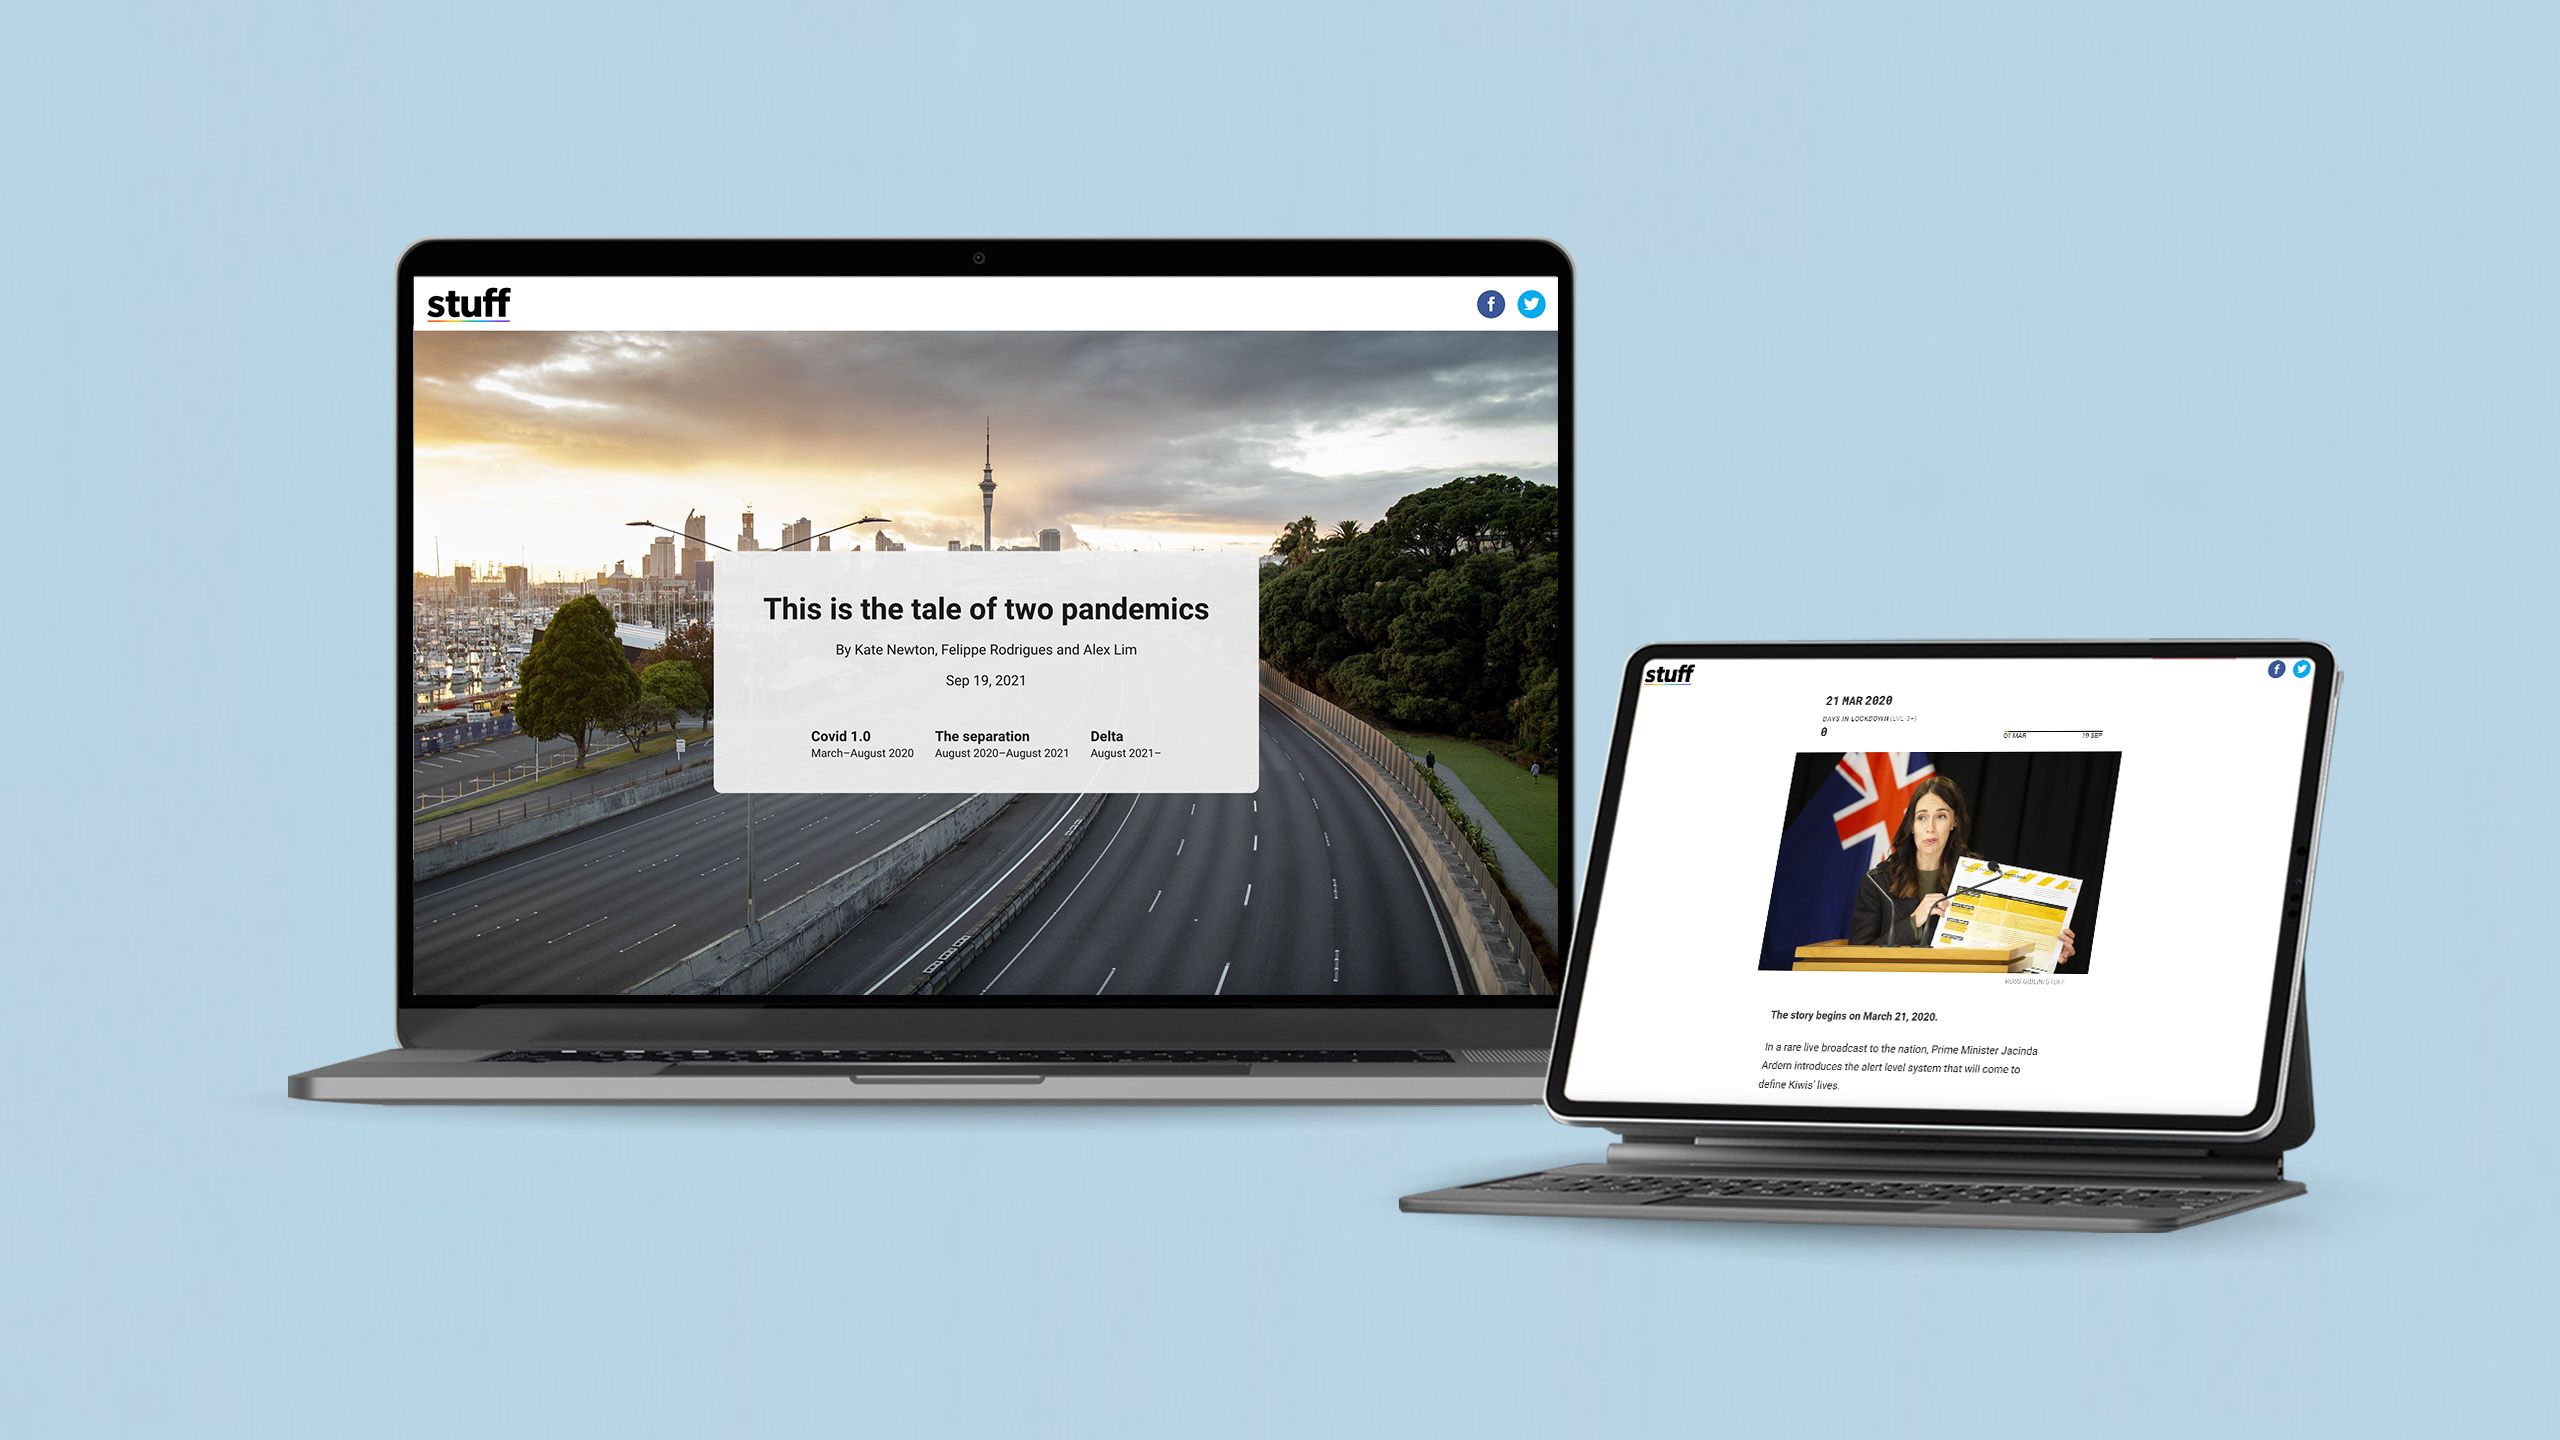
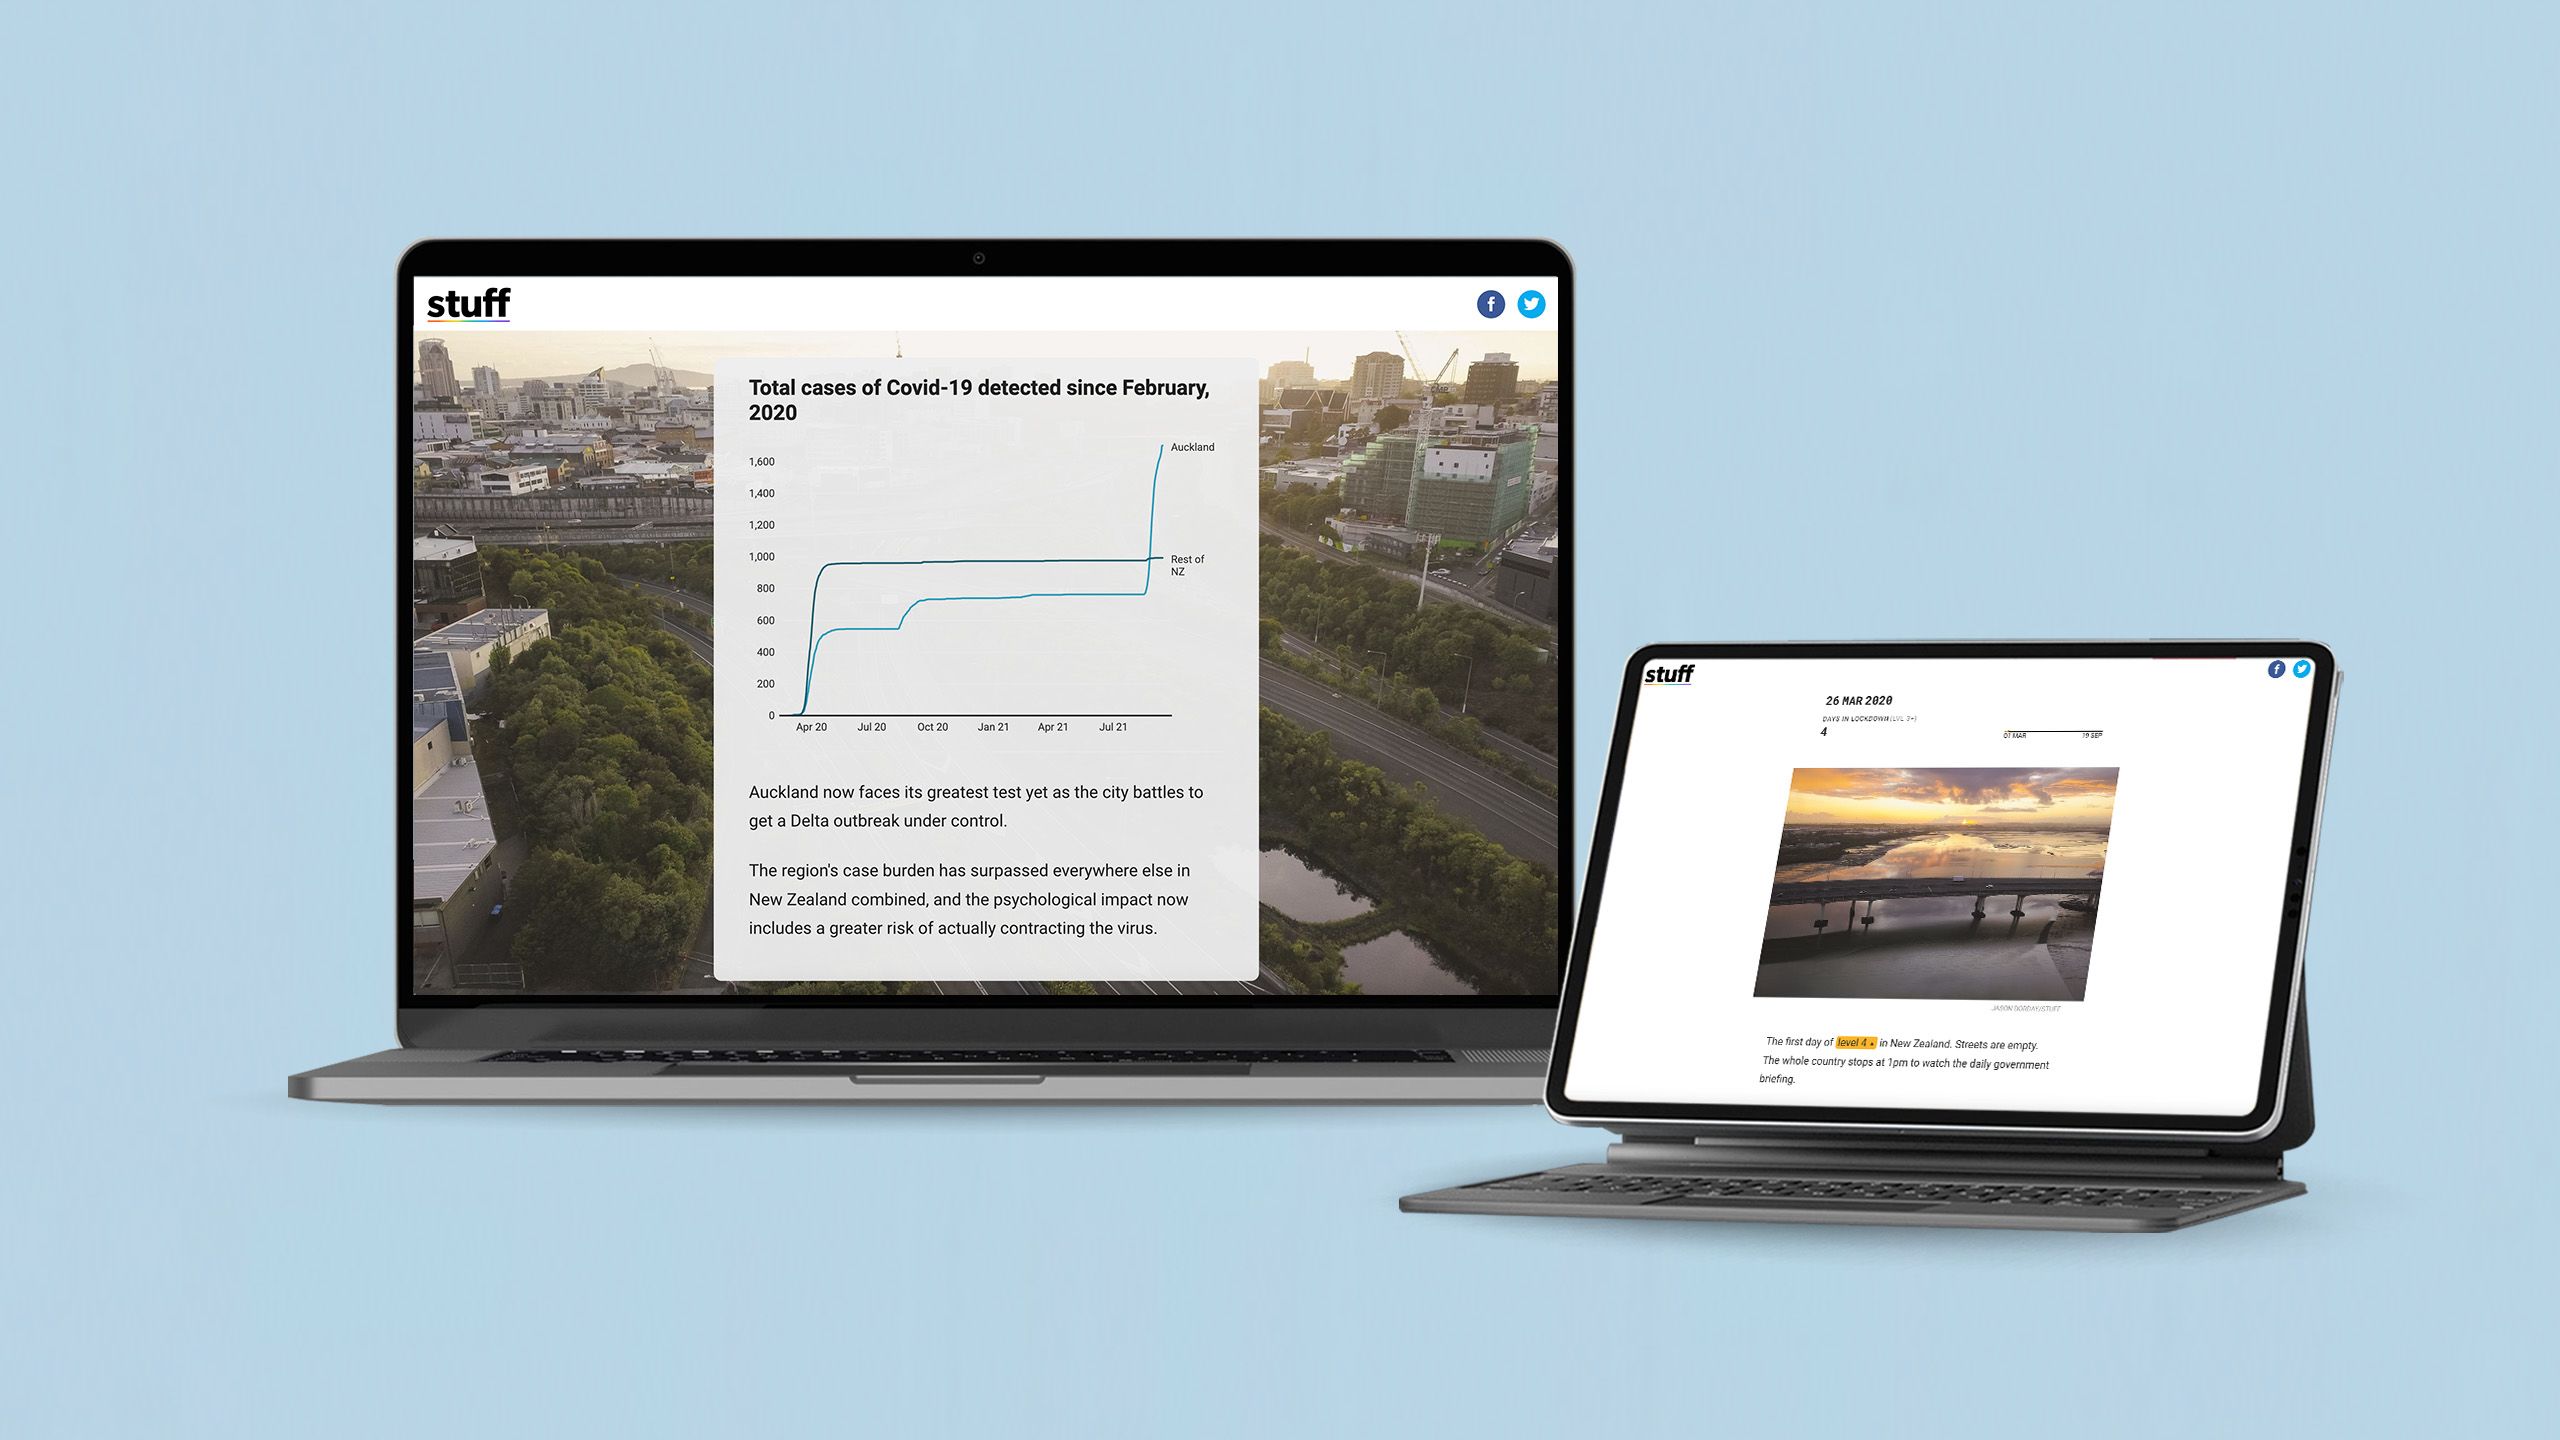
11. The tale of two pandemics
What it is: a report on the impact of the ongoing COVID-19 pandemic in Auckland, NZ.
Who created it: Stuff.
Why we picked this example:
In this report, haunting photographs call back to the early days of COVID-19 lockdowns, while clean, simple graphs showcase case counts and other data. Our favourite graphics here are the scrollmation counter and chart, which illustrate the number of days in lockdown next to COVID-19 case counts both in Auckland and across the rest of New Zealand.


How to make multimedia content
Ready to dive into multimedia content? Traditional CMS and web builders enable you to embed basic imagery and videos in your written content and play around with typography in a limited way. To go beyond that — adding scroll effects, audio, interactivity, and more — usually requires working directly with a developer or web designer.
But with the notoriously limited bandwidth of technical resources, who has time for that? To build engaging and compelling multimedia stories like the examples above — without waiting around for busy web developers — a dedicated immersive content platform is your best bet.
Immersive content providers like Shorthand are built specifically for writers, editors, and digital designers, not web developers. That means the platform requires no code whatsoever. Simply drag-and-drop dynamic, interactive graphics, and other elements into your story and you’re ready to hit “publish.”
As for actually building out your multimedia content, here’s our advice:
- Avoid adding media types just for the sake of calling it multimedia. Use a variety of media content when each adds something to your story — catering to different audience preferences, for example, helping readers visualise data, or improving the user experience (UX).
- Multimedia offers a huge opportunity to make your content more accessible to a wider audience. Be sure to consider this as you build your stories, adding captions to videos, using alt-text for images and audio content, and ensuring your content is visually accessible.
- Remember to optimise all your media types for viewing on different screen sizes. Videos, scroll effects, data visualisations… every element needs to work on desktop computers, tablets, smartphones, and any other screen where your audience may consume digital content.