
How to write an annual report


In this guide, we’ll show how leading teams are building immersive annual reports — turning a compliance exercise into a strategic opportunity.
We'll cover:
- What is an annual report?
- Why you need to write an annual report
- What do annual reports look like?
- The rise of immersive annual reports built as visual stories
- What to include in your annual report
- Nine tips for creating an annual report that has real impact for all stakeholders
Before we get started, if you're looking for annual report examples, check out our list of nine stunning annual reports. Or, if you're ready to start your own, look through our selection of ten free annual report templates.
Start creating with Shorthand
It's the fastest way to publish beautifully engaging annual reports, internal comms, and more.


What is an annual report?
An annual report is a comprehensive overview of the performance of a non-profit organisation. Annual reports typically include financial statements, statements from the CEO and Board Chair, and key activities and accomplishments.
Generally, annual reports are intended to offer a transparent view of an organisation's activities over the course of a financial year.
As we'll cover in this guide, annual reports are also a major opportunity to promote, market, and advance an non-profit's mission.
Why you need to write an annual report
Non-profit organisations and public companies produce annual reports for three main reasons.
Meet your legal obligations
In many jurisdictions, nonprofits are required to produce annual reports in order to maintain their tax-exempt status. Even where financial disclosure is enough, annual reports are still recommended. The same is true for public companies, who in the US need to file with the Securities and Exchange Commission.
Showcase your impact
It's one thing to show your stakeholders what you did; it's another thing to prove your impact. Annual reports are a perfect opportunity to show off your concrete successes, either with qualitative stories — such as case studies and profiles — or with quantitative data.
Celebrate your community
Successful non-profits take a village, with donors, leadership, staff, volunteers, and community stakeholders all playing their part. There are many valid reasons why people work with non-profits, and not everyone wants or needs public recognition. But let's face it: plenty of your community will want recognition, and an annual report is a great place to celebrate their contribution.
What do annual reports look like?
This is going to sound like a contradiction in terms, but six months ago I read a beautiful annual report.
The report was published by South African charity mothers2mothers, an Africa-based NGO working to deliver health, hope, and an HIV-free future.


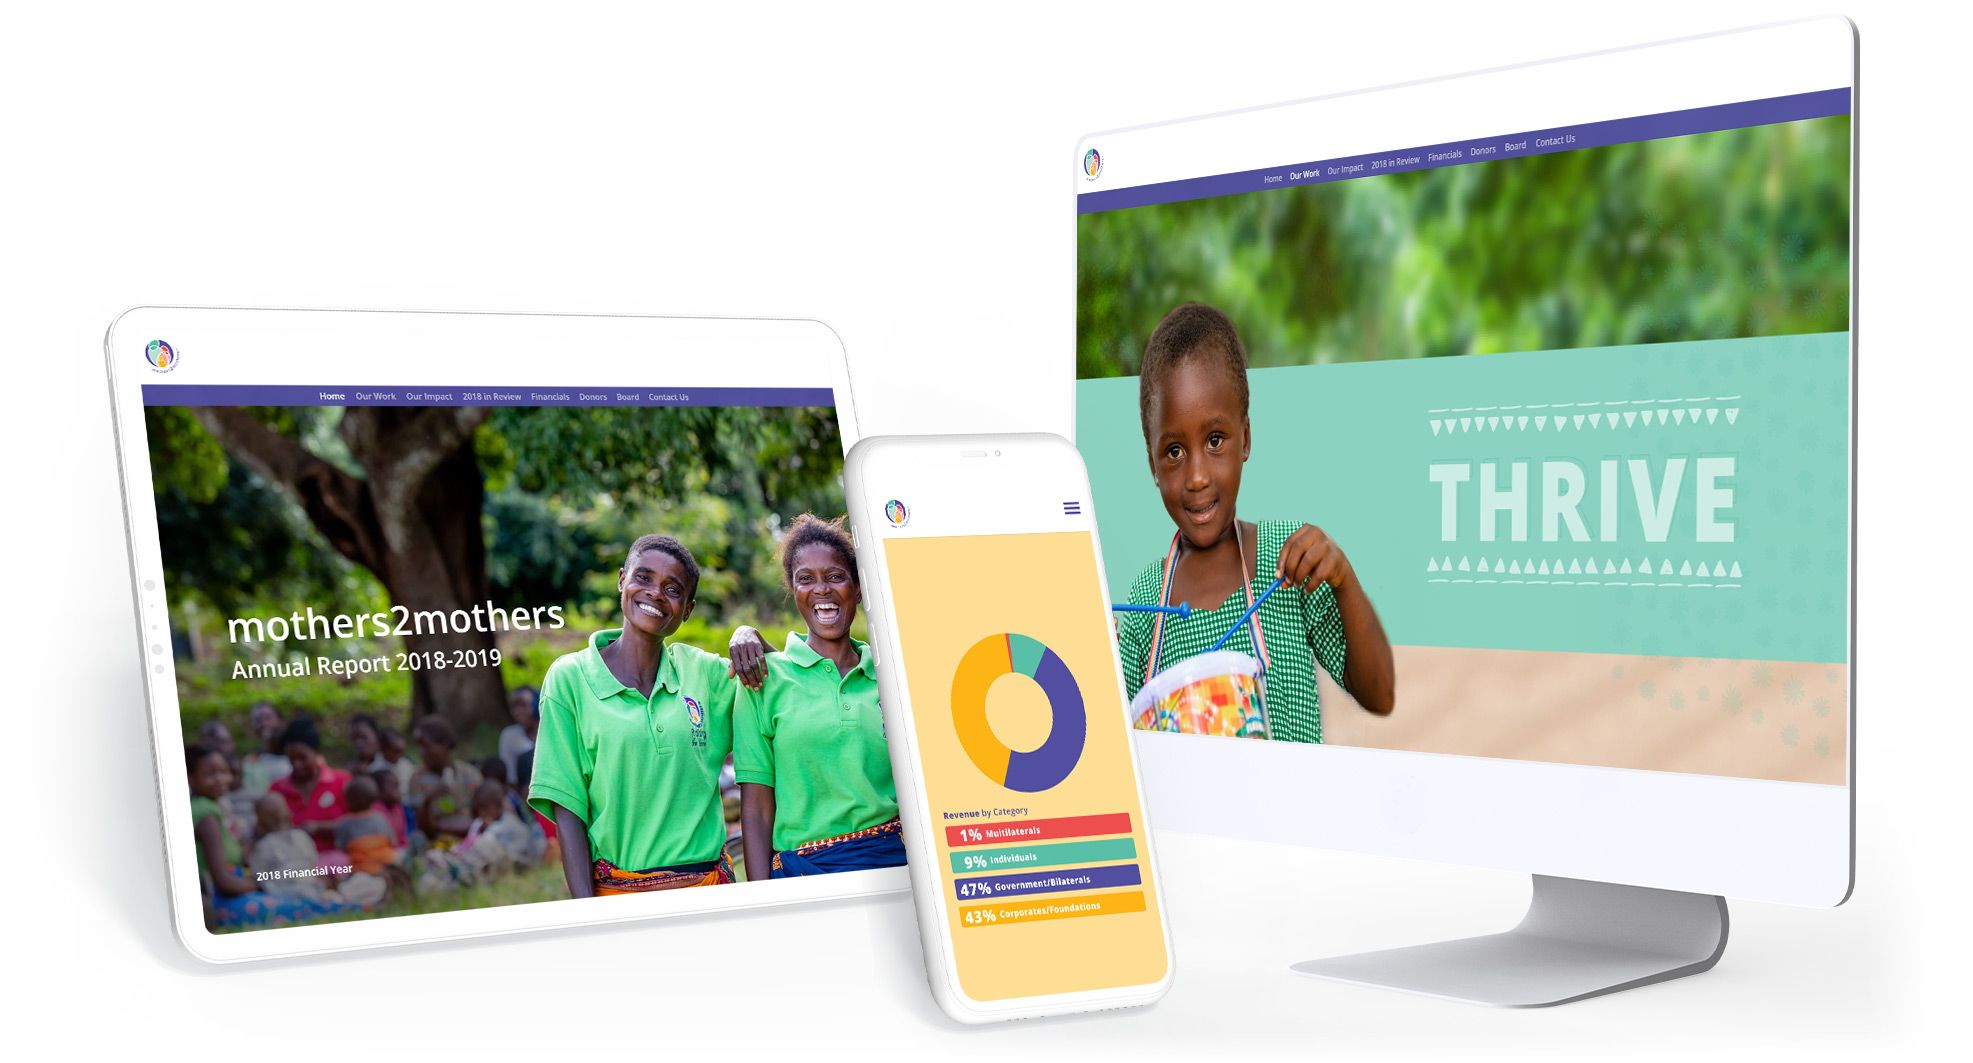
This annual report is unusual for three reasons. First, I actually wanted to read it. Who — apart from employees, board members, and big donors (maybe) — actually reads the annual report of a non-profit?
Second, it was beautiful to look at. It was a delightful and immersive reading experience.
Third, it was published as a responsive webpage — not a PDF. I could read it on my phone. Not once did I pinch and zoom. It didn’t feel like it was made primarily for print.
Looking for more digital storytelling inspiration? Sign up for our newsletter and get the best digital stories in your inbox.
The underwhelming impact of (some) annual reports


Why does this matter?
Annual reports are a statutory requirement. Across sectors, failing to publish them can carry serious regulatory, legal, or financial consequences.
But they’re not just an obligation — they’re an expensive obligation. Annual reports aren’t easy to produce. They require input from the CEO, the board, finance, comms, design, and staff across the organisation.
To rub salt into the wound, most annual reports barely get opened, let alone read. Mostly published as PDFs (with poor cousin versions occasionally published on a legacy CMS), they’re artefacts of a previous era — an era of desktop printers and email attachments.
Given the underwhelming impact these reports tend to have, most of them are a legally obligated waste of time.
This is a missed opportunity — because, as we saw with mothers2mothers, they could be so much more.
Immersive annual reports
So, what’s the solution?
How can businesses, nonprofits, and institutions turn annual reporting into an opportunity?
Over the last decade, technology has moved on from the PDF. Most people read on multiple devices, including tablets and phones. Nobody wants the irritation of pinching and zooming a PDF on a smartphone.
Web technologies — including more powerful browsers and digital storytelling platforms — are allowing for immersive, interactive, and fully responsive reading experiences that far outstrip what can be achieved with a PDF.
This has led to the rise of immersive annual reports. These reports build on techniques used by media brands like Sky, BBC, and NBC News to keep readers’ attention.

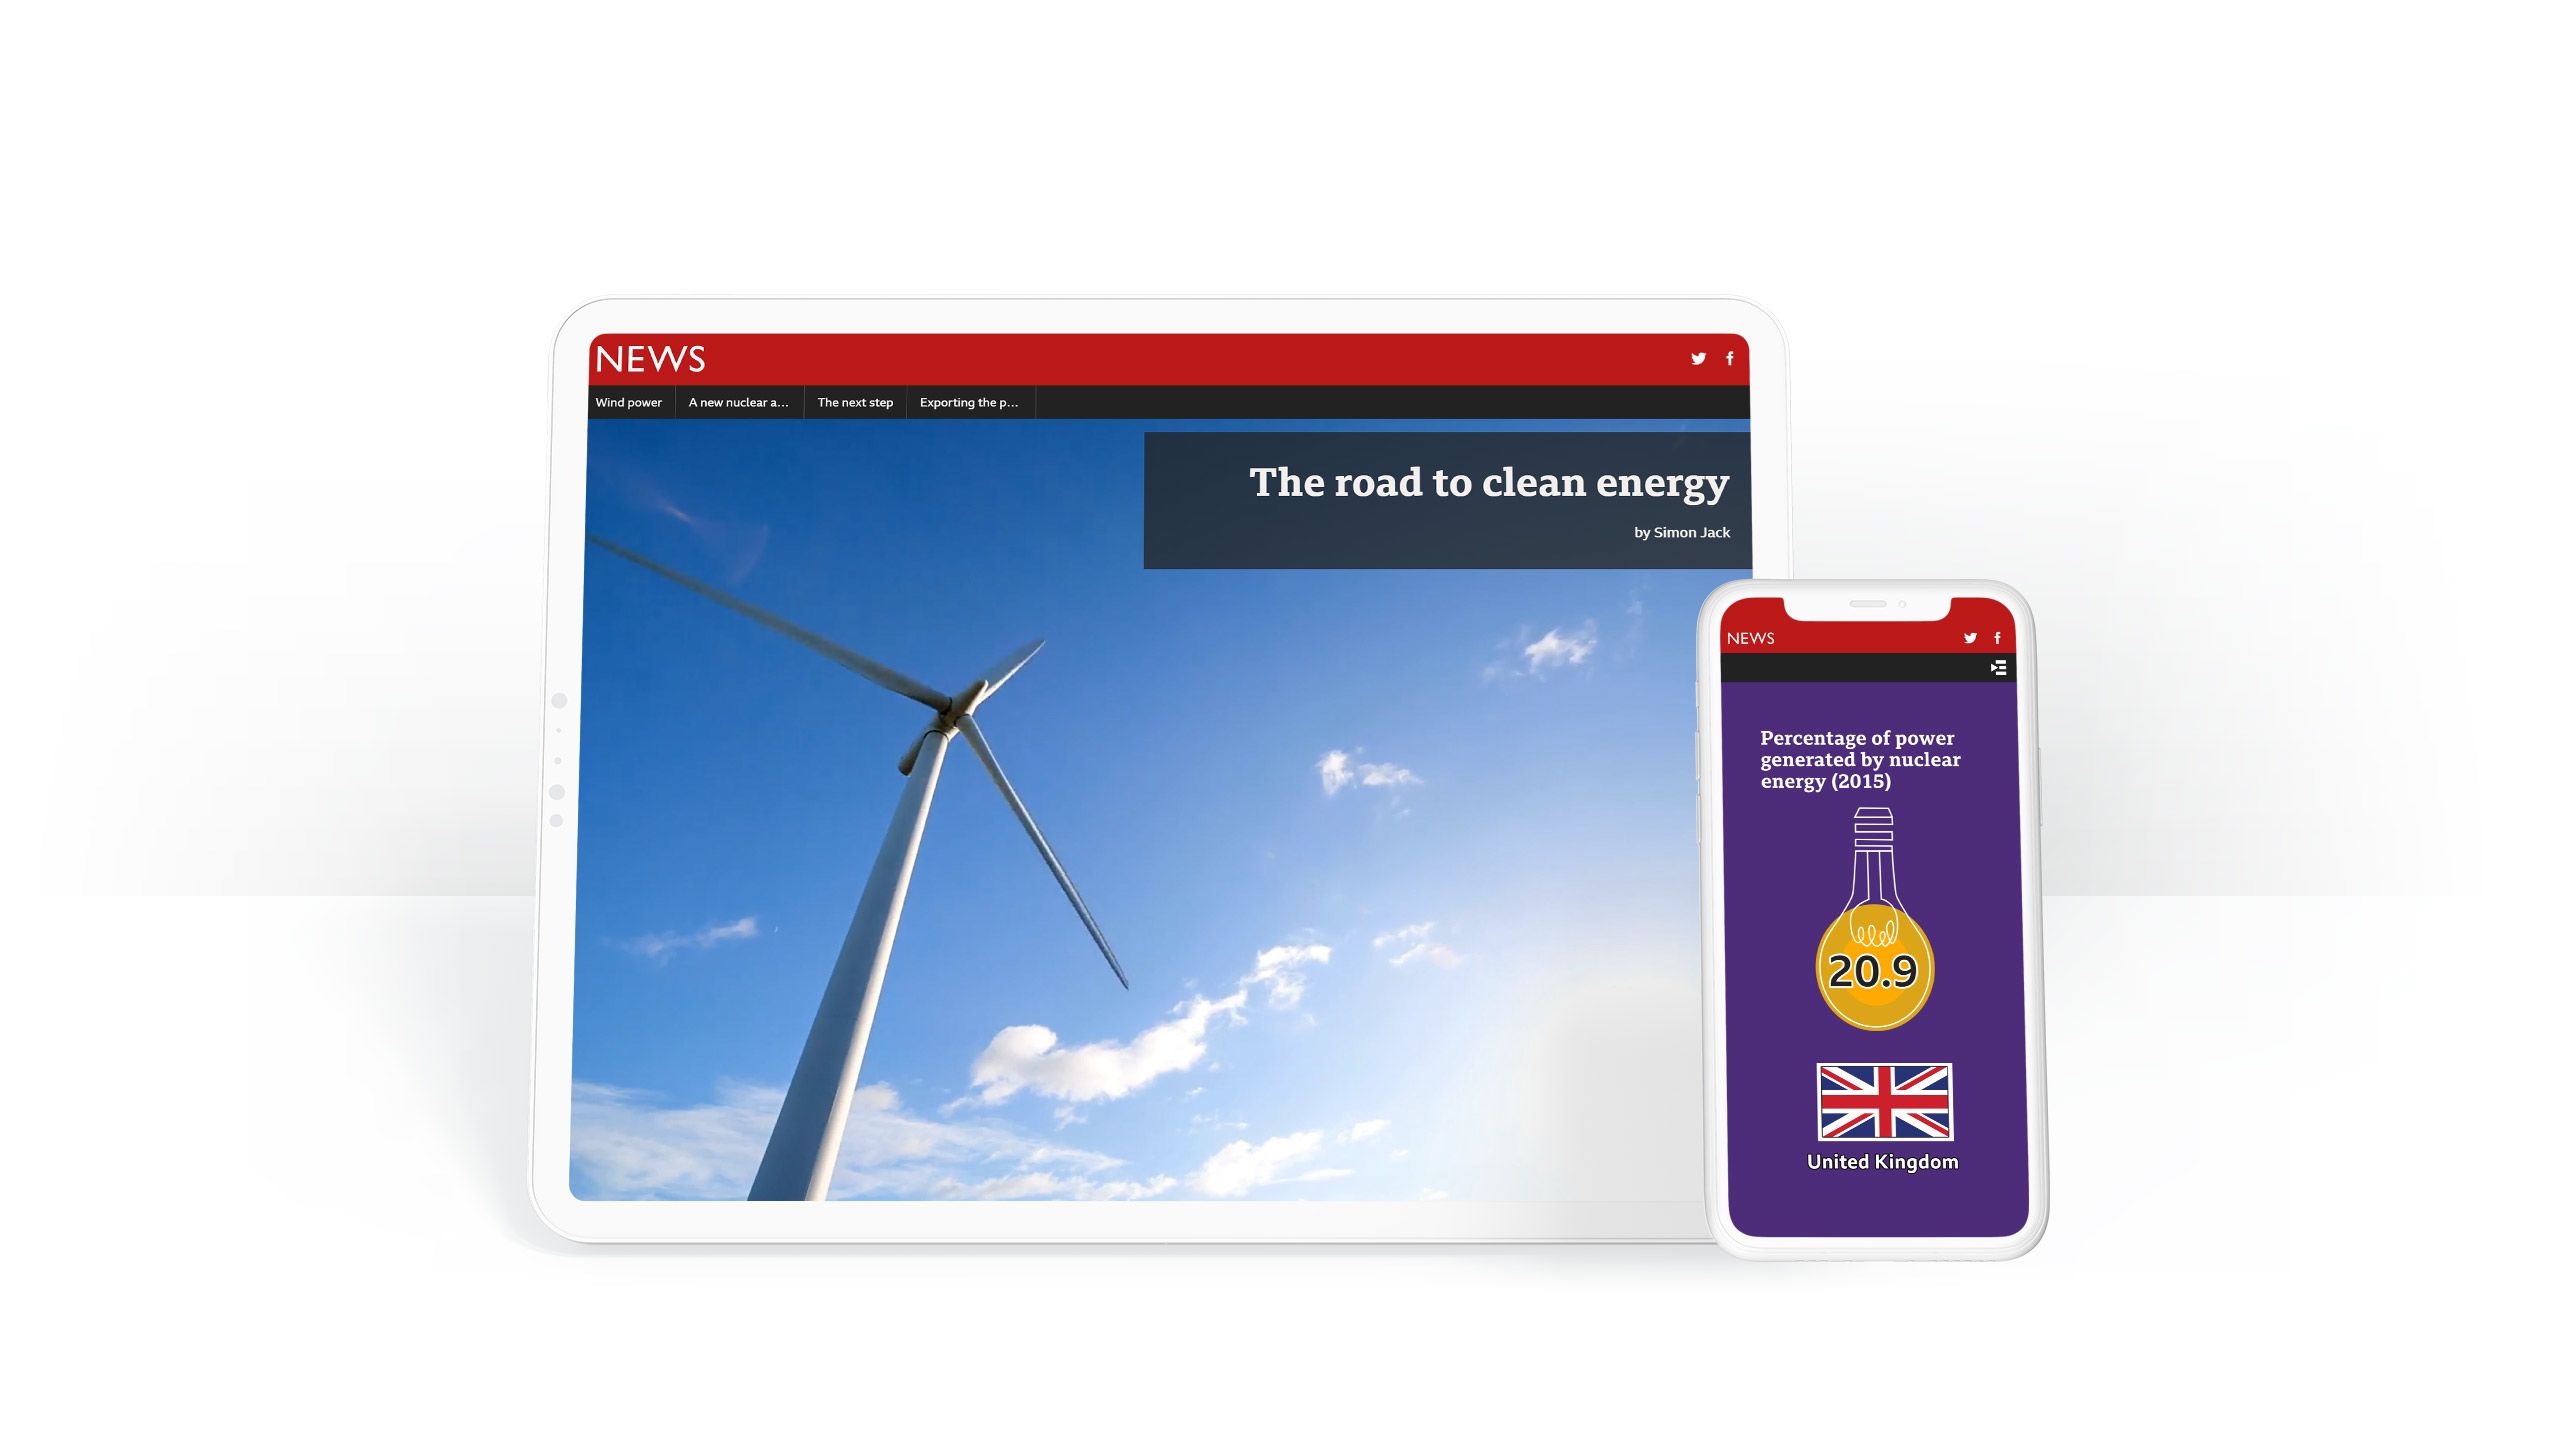

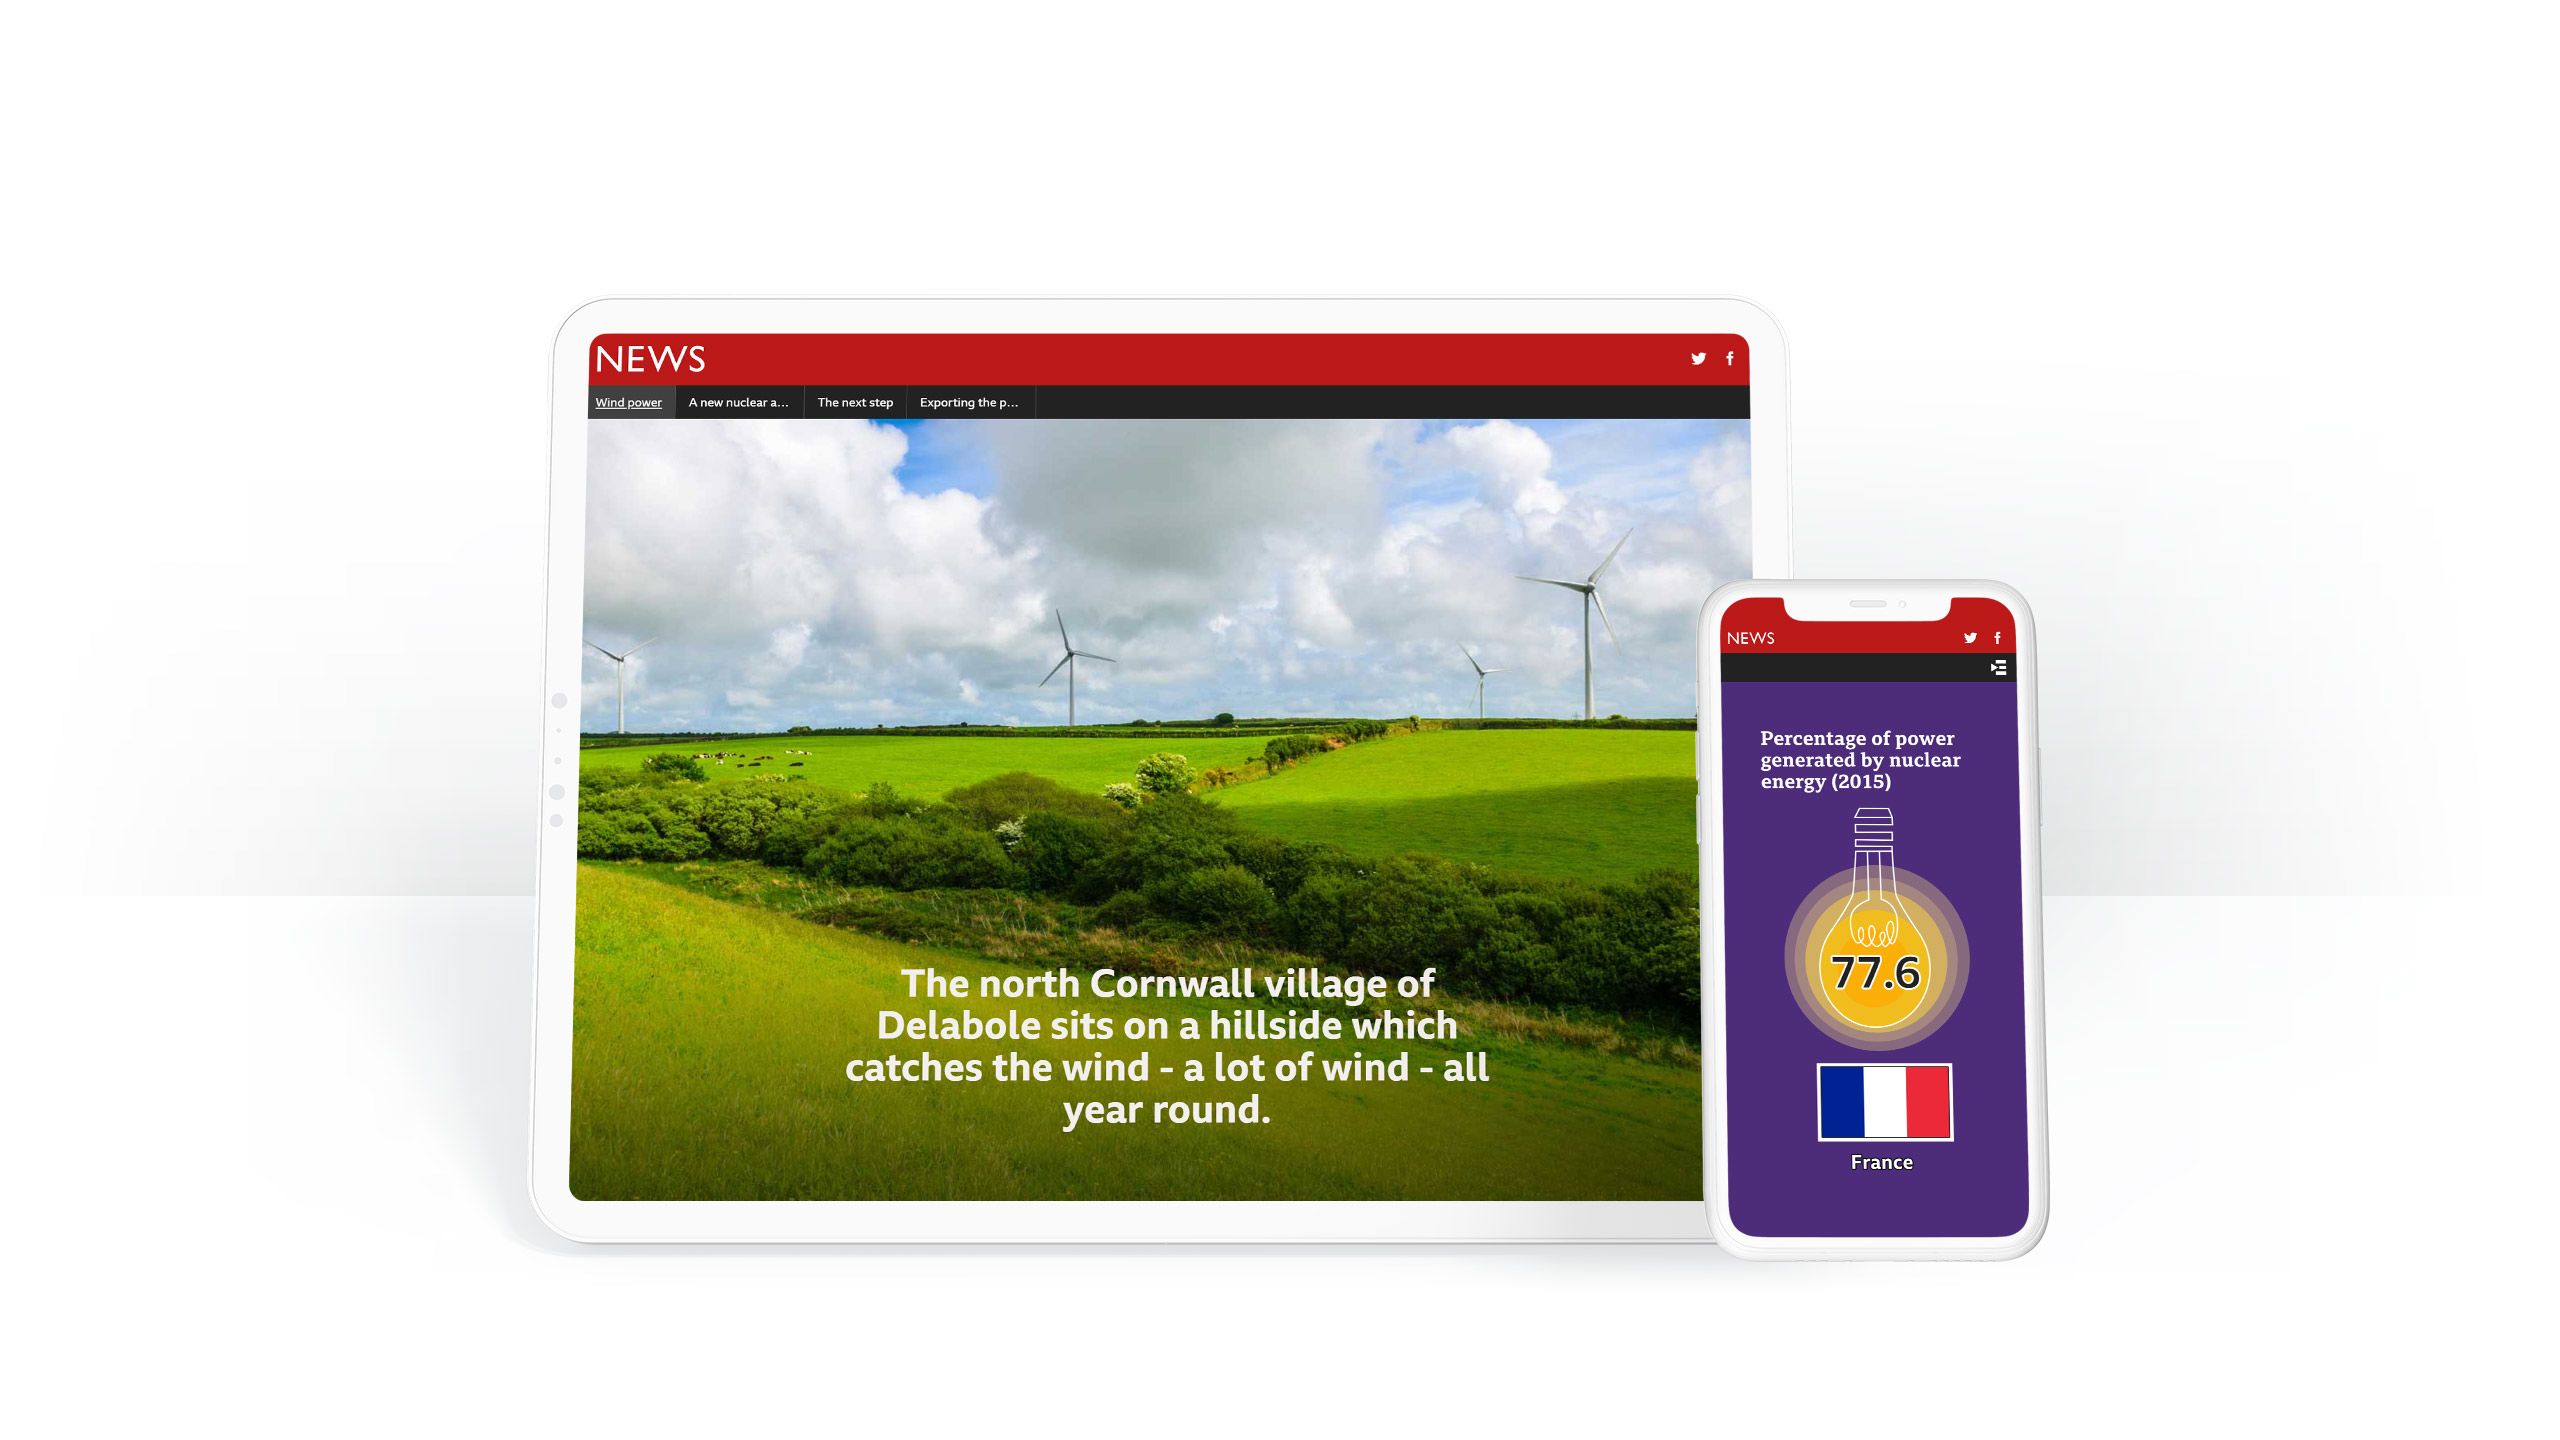
In stories such as the BBC's report on clean energy, shown above, rich media are integrated with scroll-based animation techniques to capture and retain the reader's interest.
Leading NGOs and brands are doing the same.
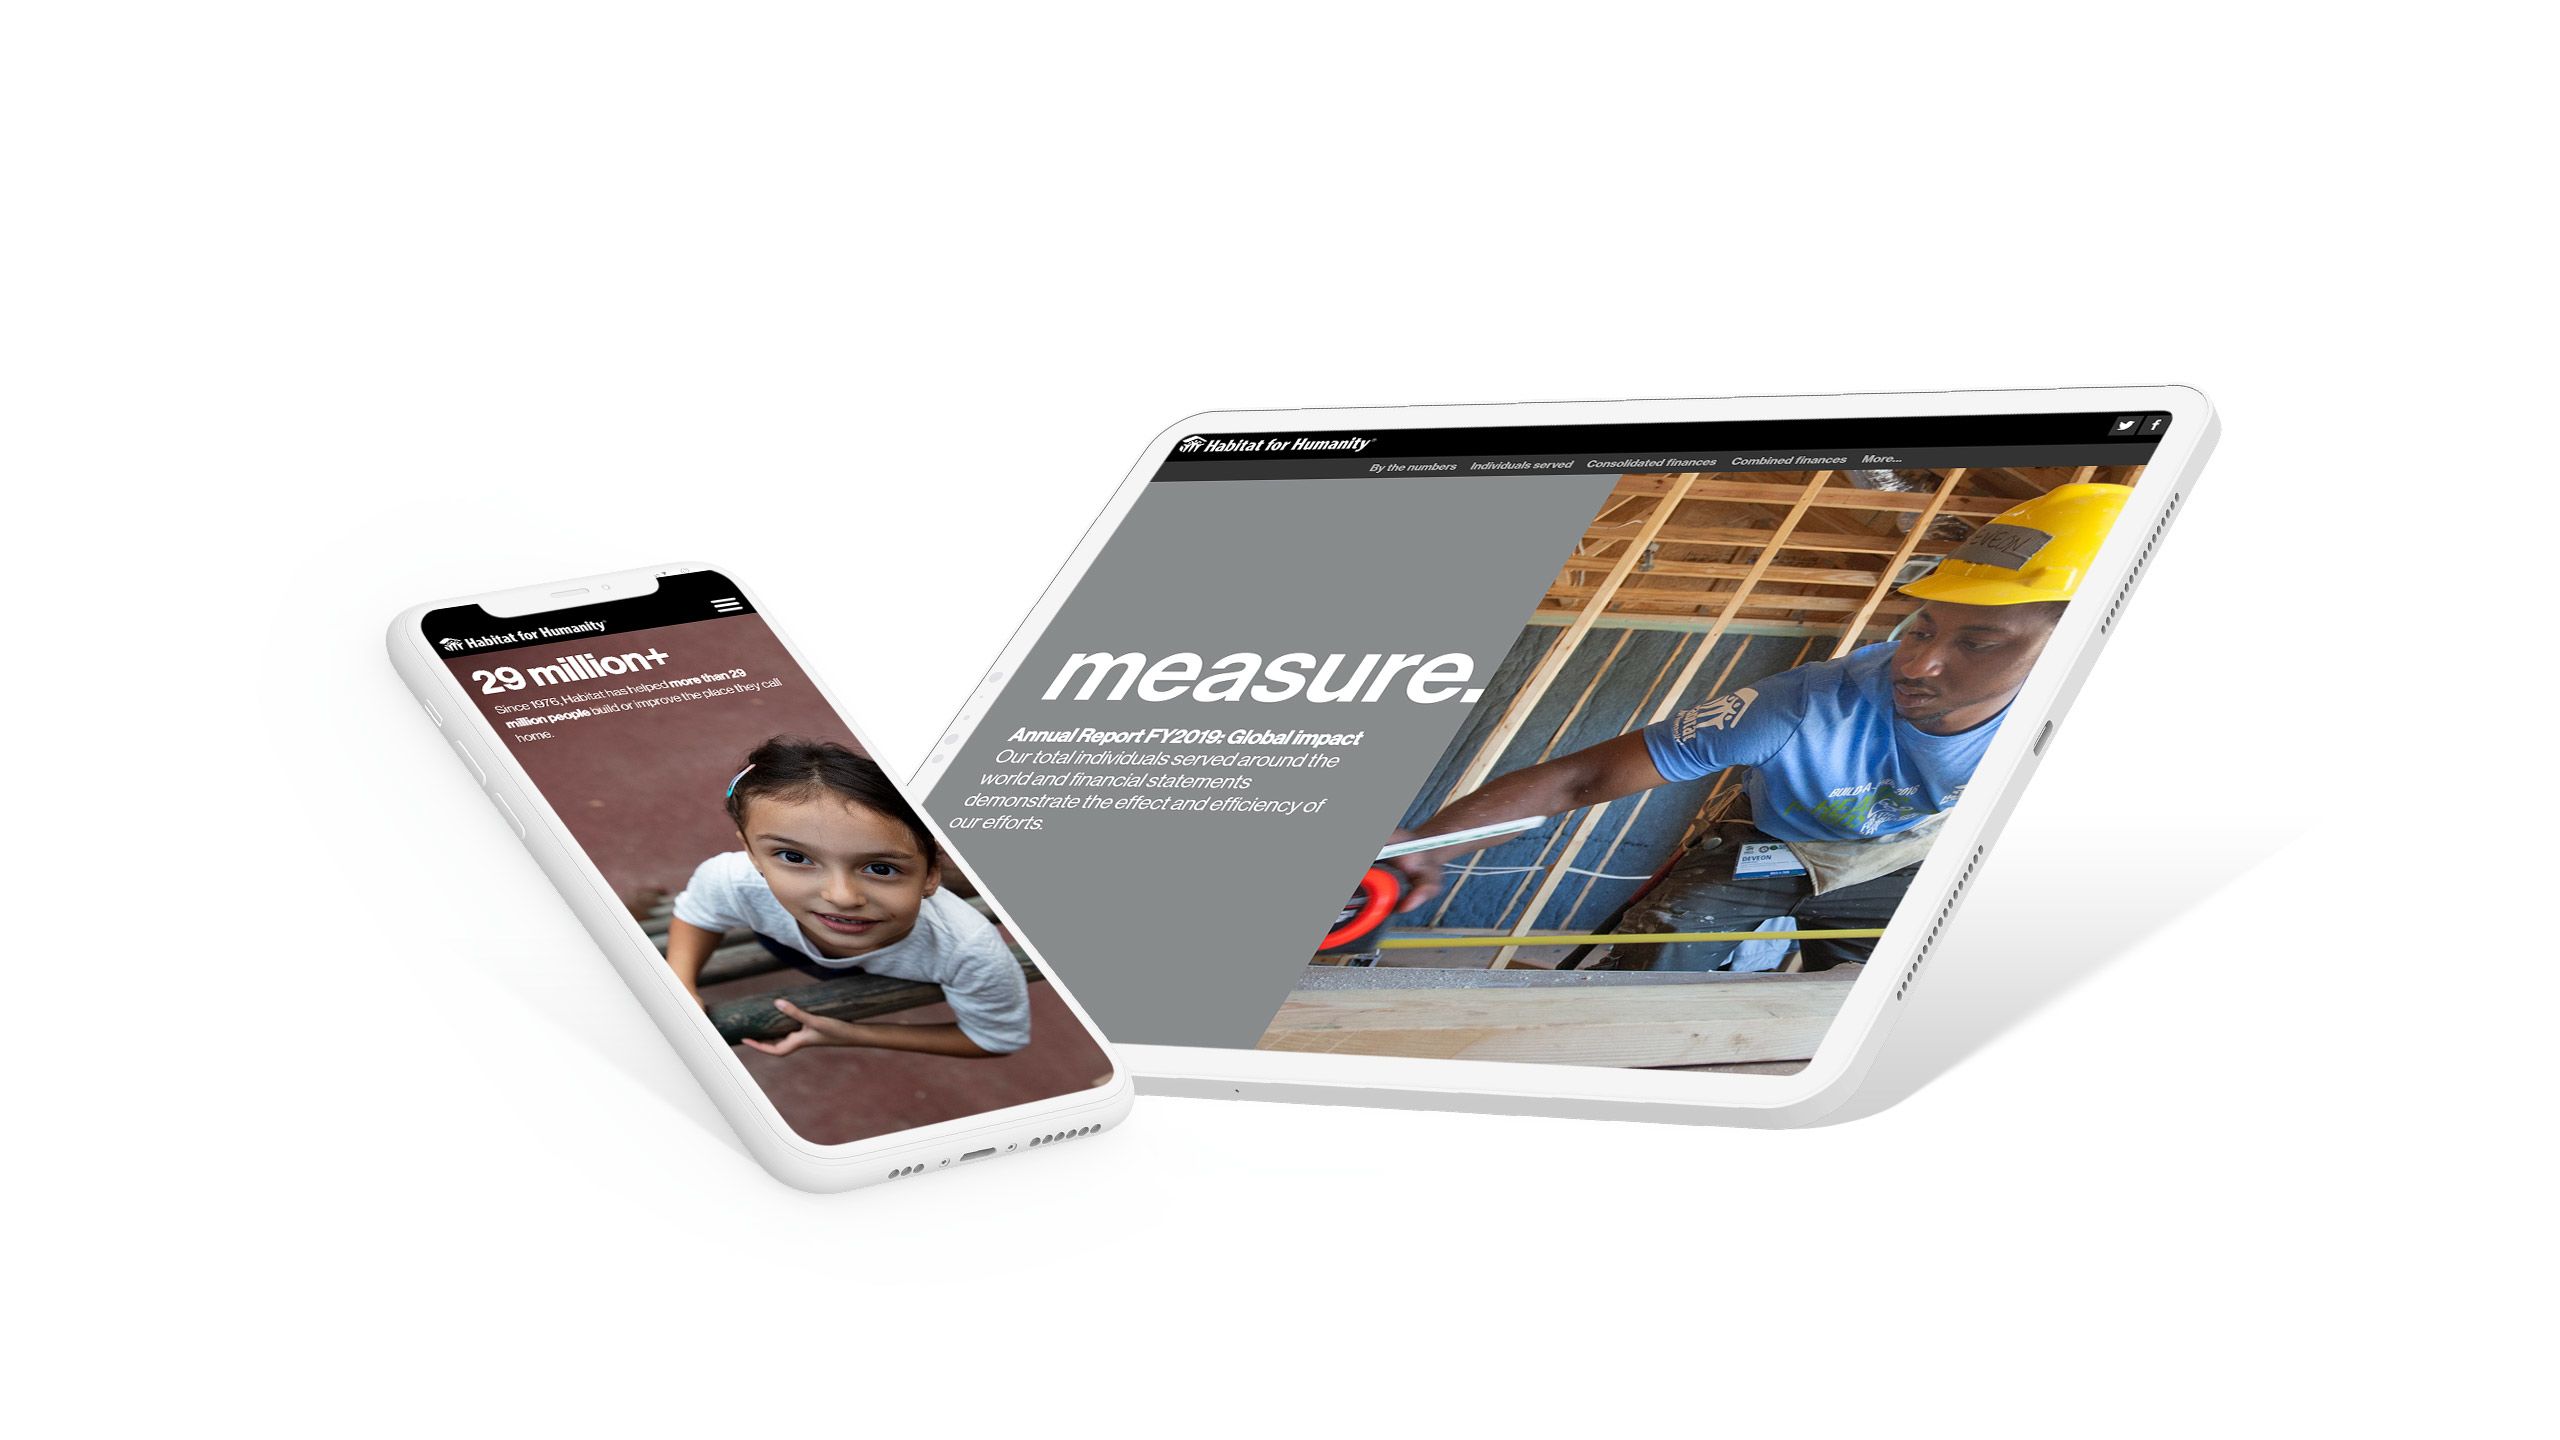
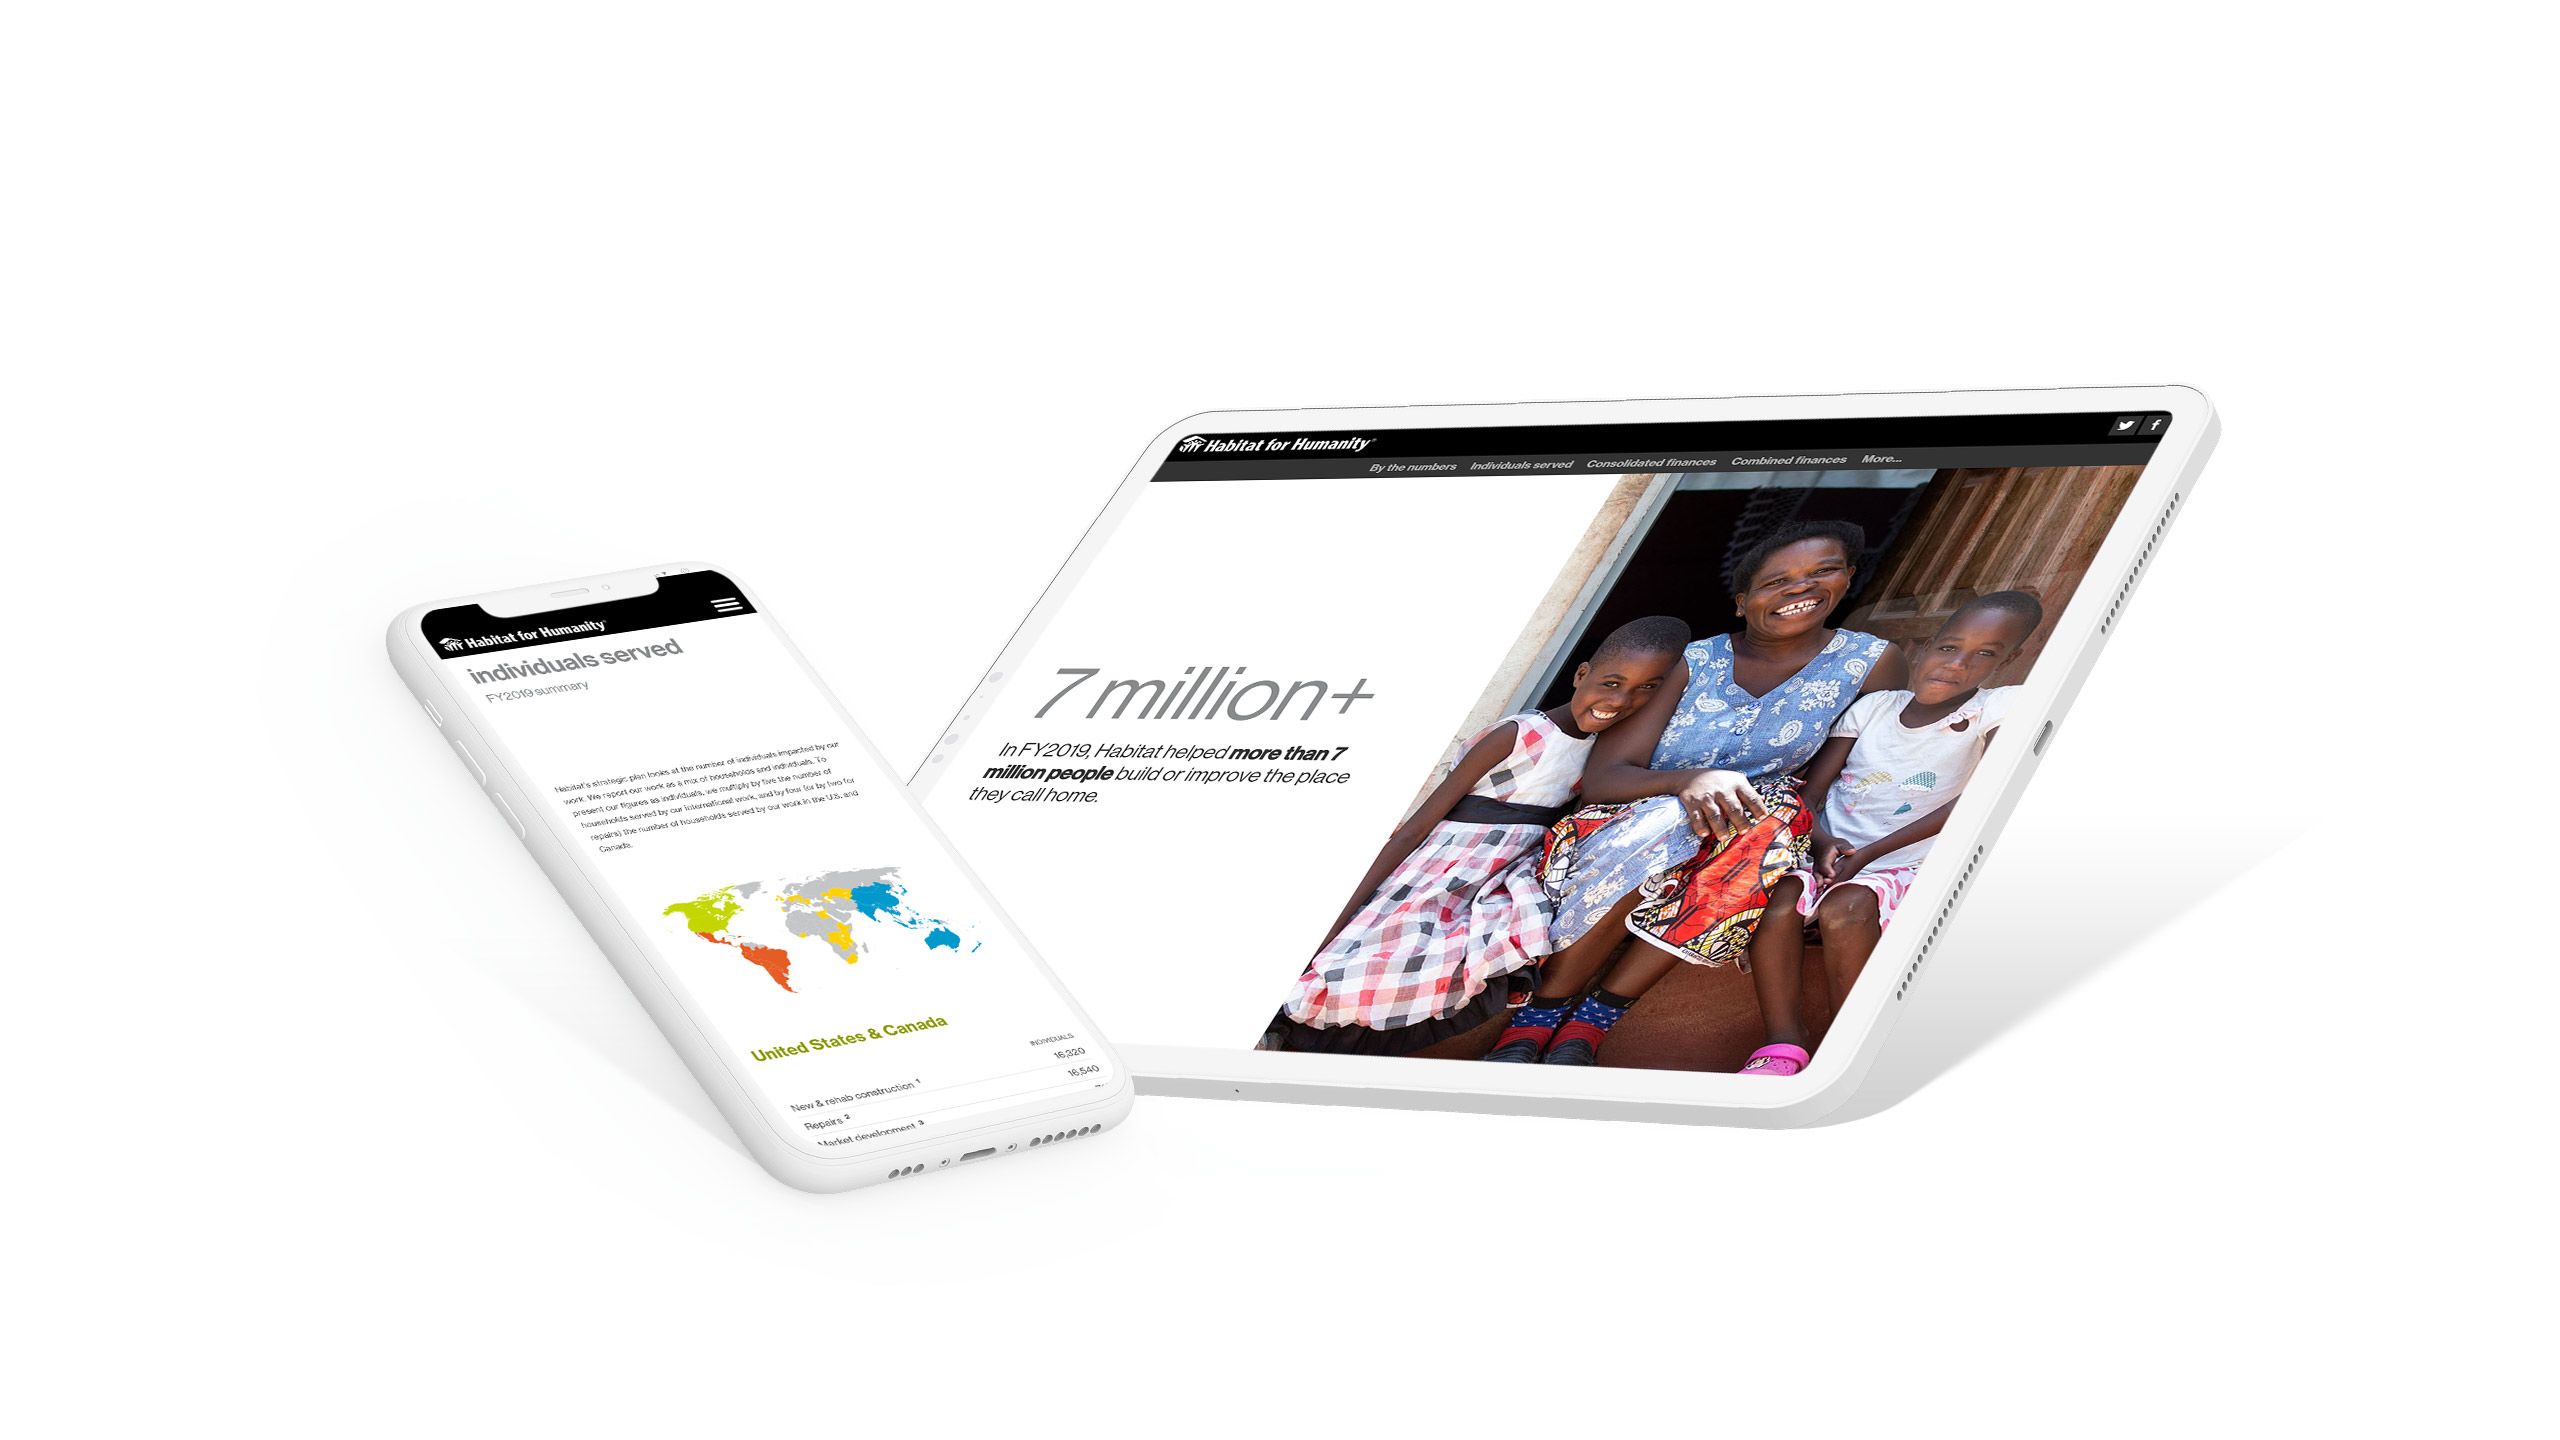
Take, for example, Habitat for Humanity, who have been publishing their annual reports as immersive digital stories for several years. Their annual report design is impressive — and accessible to all.


What to include in your annual report
While annual reports are a hugely flexible format, most reports include many of the following elements.
A letter from the CEO or Board Chair
The letter from leadership is a chance to celebrate the year's accomplishments, and chart a course for the year ahead. It should be inspiring, evocative, and written in plain English. It can be difficult to give feedback to leadership, but as this letter often opens the annual report, it's worth spending time crafting a letter that people will actually excite and capture the attention of the reader.
Navigation help, such as a menu or table of contents
An annual report is a large piece of content and it's rare that anyone will read the entire report from beginning to end. To help people find what they're interested in, add a menu to the top of your report. For your print copy, add a table of contents. Note: we recommend against distributing a PDF-only annual report.
Your mission statement
An annual report is, among with things, an exercise in branding for your non-profit. Make sure you include your mission statement and key messages early in your annual report.
Data showcasing your impact
If you have data, use it. There's nothing more powerful than well-executed data visualisations — including charts, graphs, and maps — in an annual report. If you want to get inspired with great examples of data visualisations, check out our guide here.
Testimonials
Try to includes stories, case studies, and other testimonials from your stakeholders from the last year. This will humanise your report and make it much more compelling to read.
Profiles
Some annual reports go a step further and include profiles of team and community members. This is another great way to showcase the people behind your non-profit.
Donor list
Some non-profits like to celebrate their donors with a list in their annual report. This is perfectly acceptable, though make sure the list doesn't take up too much of the report, as it will likely be skimmed by most readers.
Fundraising highlights
Your stakeholders want to know that your organisation is resilient and stable. The best way to do this is to present highlights from your fundraising efforts from the past year. This should include infographics and data visualisations — including easily-understood graphs and pie charts — showing your progress.
Multimedia
Effective annual reports include a range of media, including photos, videos, illustrations, infographics, animations, and more. While this is impossible to include in a typical PDF, new digital storytelling platforms make it possible to create immersive multimedia reports that can be read on any device. You can read some inspiring examples of annual reports in our guide here.
A call-to-action
Annual reports are a great marketing opportunity — but only if you include a call-to-action or CTA. To be clear, your contact details at the end of a PDF does not qualify as a CTA. For your CTA to work, it needs to be immediately actionable, such as a button or a form on your digital annual report.
Financial statements
Our final item is not negotiable. In most countries, your nonprofit annual report will need to include your full financial statements from the last financial year. You'll want to work with your accountant to produce this financial information.
Now that we've covered the basics, let's take a look at the actual process of writing an annual report.
If your organisation is ready to build your own immersive annual reports without writing a line of code, get started with Shorthand and create your first story free.
Nine tips for creating an impactful annual report
1. Start early
An immersive annual report is an opportunity to produce that rare beast: the annual report that actually gets read. But to execute this opportunity, you’re going to need to start early.
This is because immersive digital stories are hungry for high quality media assets. The more assets you have, the more options you’ll have to use immersive visual storytelling techniques. Make a point of producing media assets at events and projects throughout the year, so that you have plenty of options when it comes time to produce.
2. Know your audience
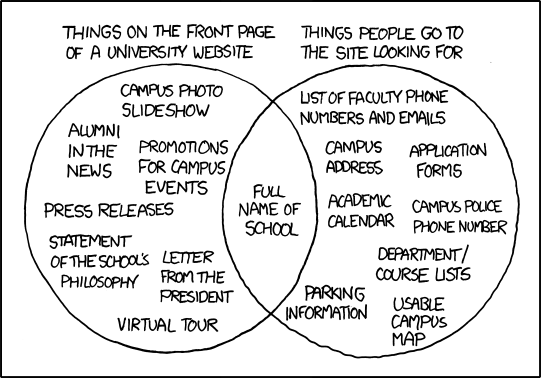
A few years ago, the popular web comic XKCD published a famous Venn diagram on the nature of university websites.

'University Website' by XKCD.
'University Website' by XKCD.
On the right side of the Venn diagram, we see all the information people want to find on the university website, including application forms and an academic calendar. On the other side, we have all the information the university wants people to see, including the letter from the president and a ‘virtual tour.’
Unfortunately, the same diagram could be produced for some nonprofit annual reports — and for similar reasons. Like university websites, annual reports have multiple, somewhat contradictory audiences.
These audiences might include:
- Internal stakeholders, including your Board, senior leadership, and staff.
- Funders — current and future.
- Volunteers and members.
- Your target audience for future volunteers, donors, and members.
- The broader public.
It won’t be easy to target all of these audiences in the same piece of content — but you won’t have a chance unless you’re crystal clear on who they actually are.
3. Collaborate
To get your annual report published in time, you will need to collaborate with two groups of people.
The first group is colleagues and contractors who are actively contributing to the production of content. It’s obviously a good idea to collaborate with these folks throughout the process.
The second group is a little different, and is made up of people who won’t contribute directly — but who nevertheless have strong opinions about what the report should look like. These opinions can block progress at key steps in the development of your report.
This second group is the trickiest to deal with. The best way to deal with them is to actively solicit their advice and feedback throughout the process. Don’t worry: you don’t have to act on everything they say. But this will ensure that no one feels ambushed or surprised by the final result. It will also reduce the risk of any nasty surprises in the days and weeks leading up to publication.
4. Build it natively for the web
Many annual reports are produced as PDFs using design software like Indesign.
There are good reasons for this. A PDF ensures that every reader sees the same thing. PDFs are portable – that's the ‘P’ in the acronym – which makes the information easily accessible by people using different operating systems. PDFs can also be read offline and printed, which can be handy at stakeholder events.
But there are many reasons why PDFs are not a great way to publish your annual report.
First, they aren’t responsive. People reading PDFs on mobile devices and small screens often struggle to read the text.
Second, they're difficult for non-designers to edit. This makes the proofing process much more painful and contentious. Multi-stakeholder publications — like annual reports — notoriously require many rounds of editing. Trust me: after round 15, your designer is going to wish you could just do it yourself.
Third, PDFs aren't native to the web. This means they can't take advantage of many of the visual techniques increasingly common in digital stories.
Fourth, you can’t properly SEO a PDF. While Google can index PDF content, it simply won’t perform nearly as well as a structured web page.
Fifth, they’re just no fun to read online. PDFs are great for print — but they are terrible for production, distribution, and consumption on the web.
Read more in our guide on the limits of PDFs.
5. Earn the attention of the reader
Nonprofits produce annual reports because they have to. As we mentioned above, in most countries annual reports are a statutory obligation.
But no one wants to read a statutory obligation. And annual reports are — once the legal i’s and t’s have been dotted and crossed – a prime opportunity to connect with a much larger audience.
But how to produce an annual report that people actually want to read? The best way is to employ the techniques used by the world’s leading digital storytellers, such as the BBC and NBC News.
These teams employ a range of techniques — including scroll-based animation, rich media, and attention-grabbing transitions — that produce some of the highest engagement rates of any content on the web. An example of this comes from NBC News.

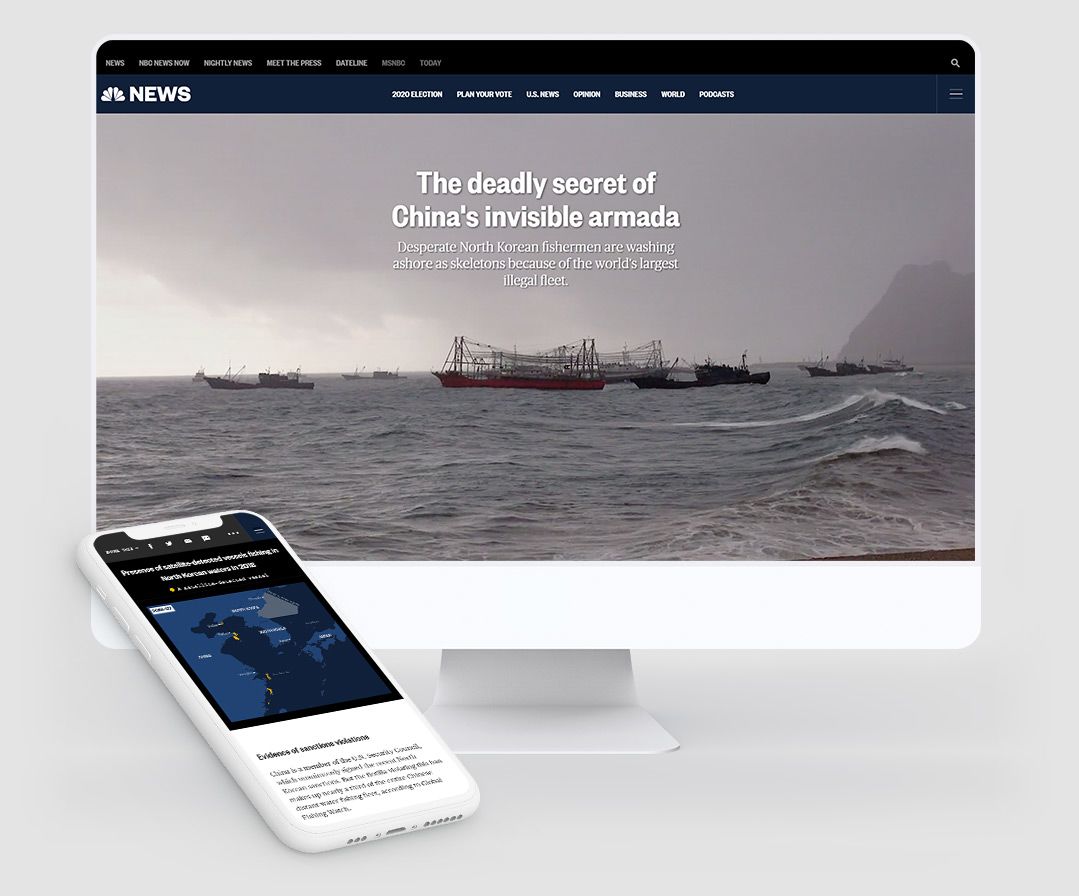
With impressive maps and video, the team at NBC have struck a careful balance between interactive media and immersive text. It’s a piece of content that respects the attention of the reader.
6. Use data
Data visualisation is the secret sauce of every compelling annual report. Most nonprofits collect data on the impact of their activities. Make the most of this data, as it can anchor the broader story you are trying to tell, and make it more likely that your readers stay with you through the less compelling sections.
Using a digital storytelling platform, you can also animate your data natively in the browser, without writing a line of code.
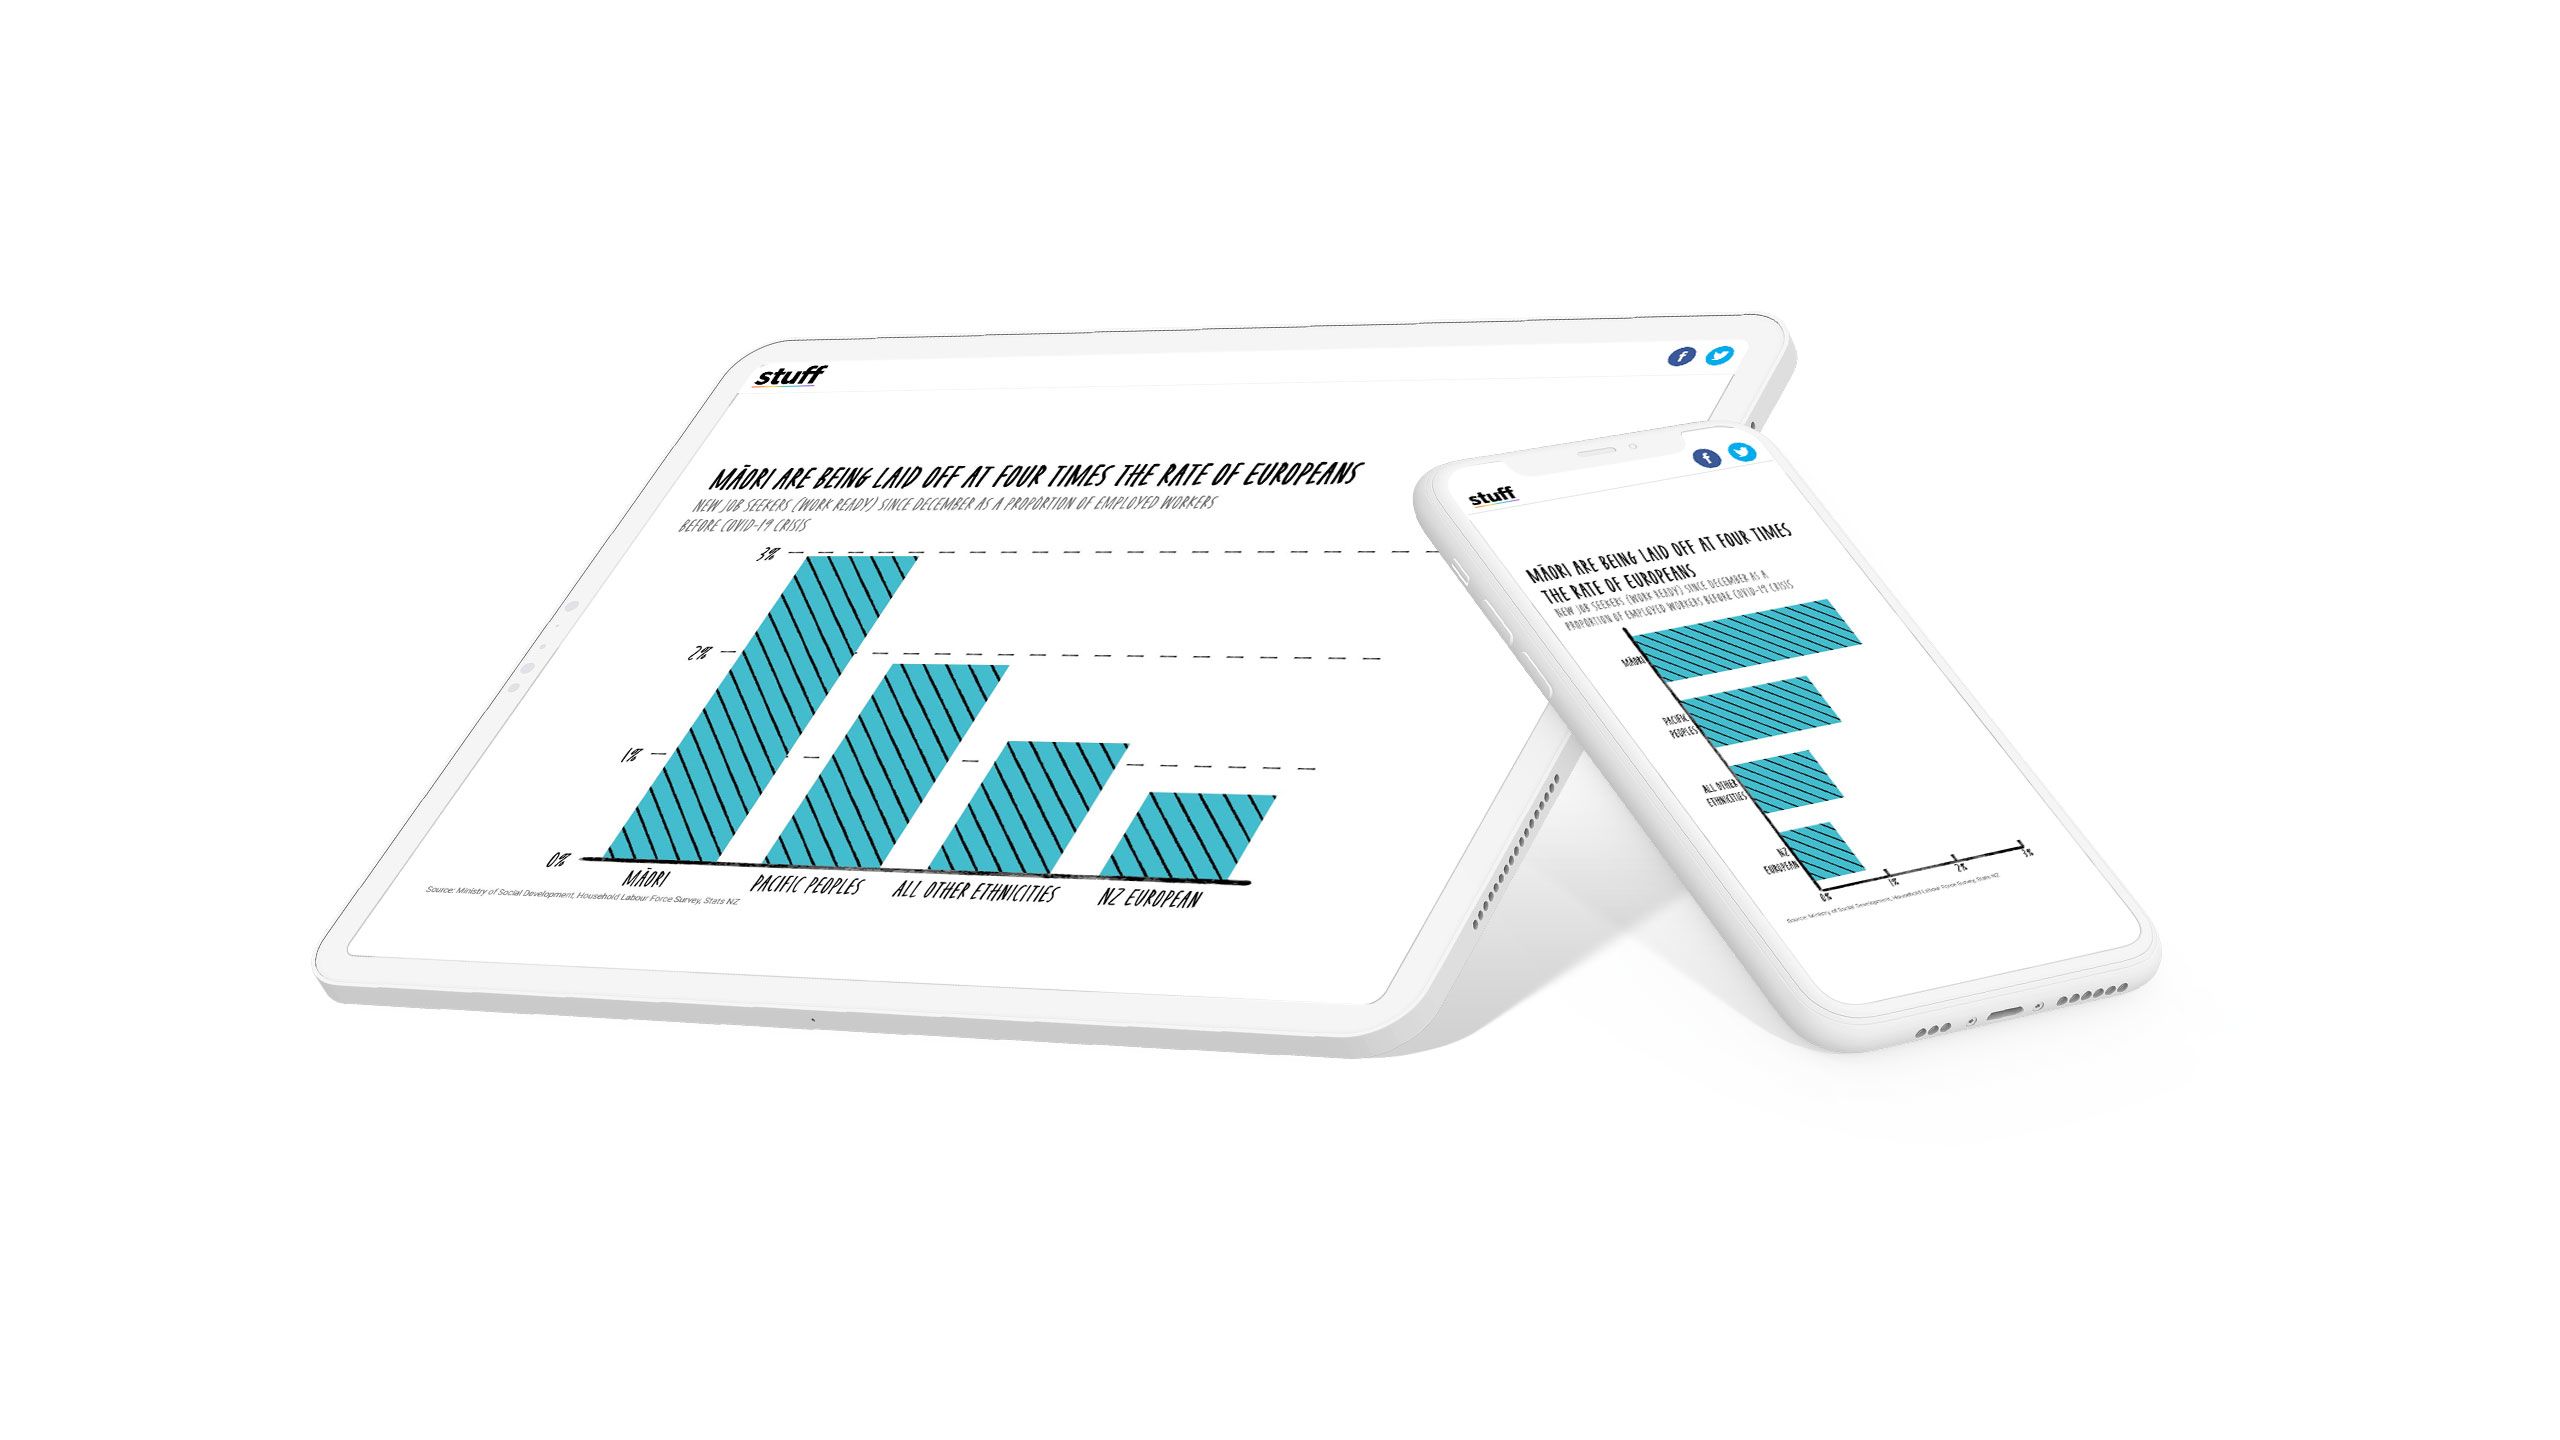
One example of this is from New Zealand media company Stuff, who animated government data on the stark social and economic impact of COVID-19.
If you're looking for more examples and inspiration of great data visualisation, check out our guide, 8 examples of powerful data stories. We've also published a large collection of data stories.


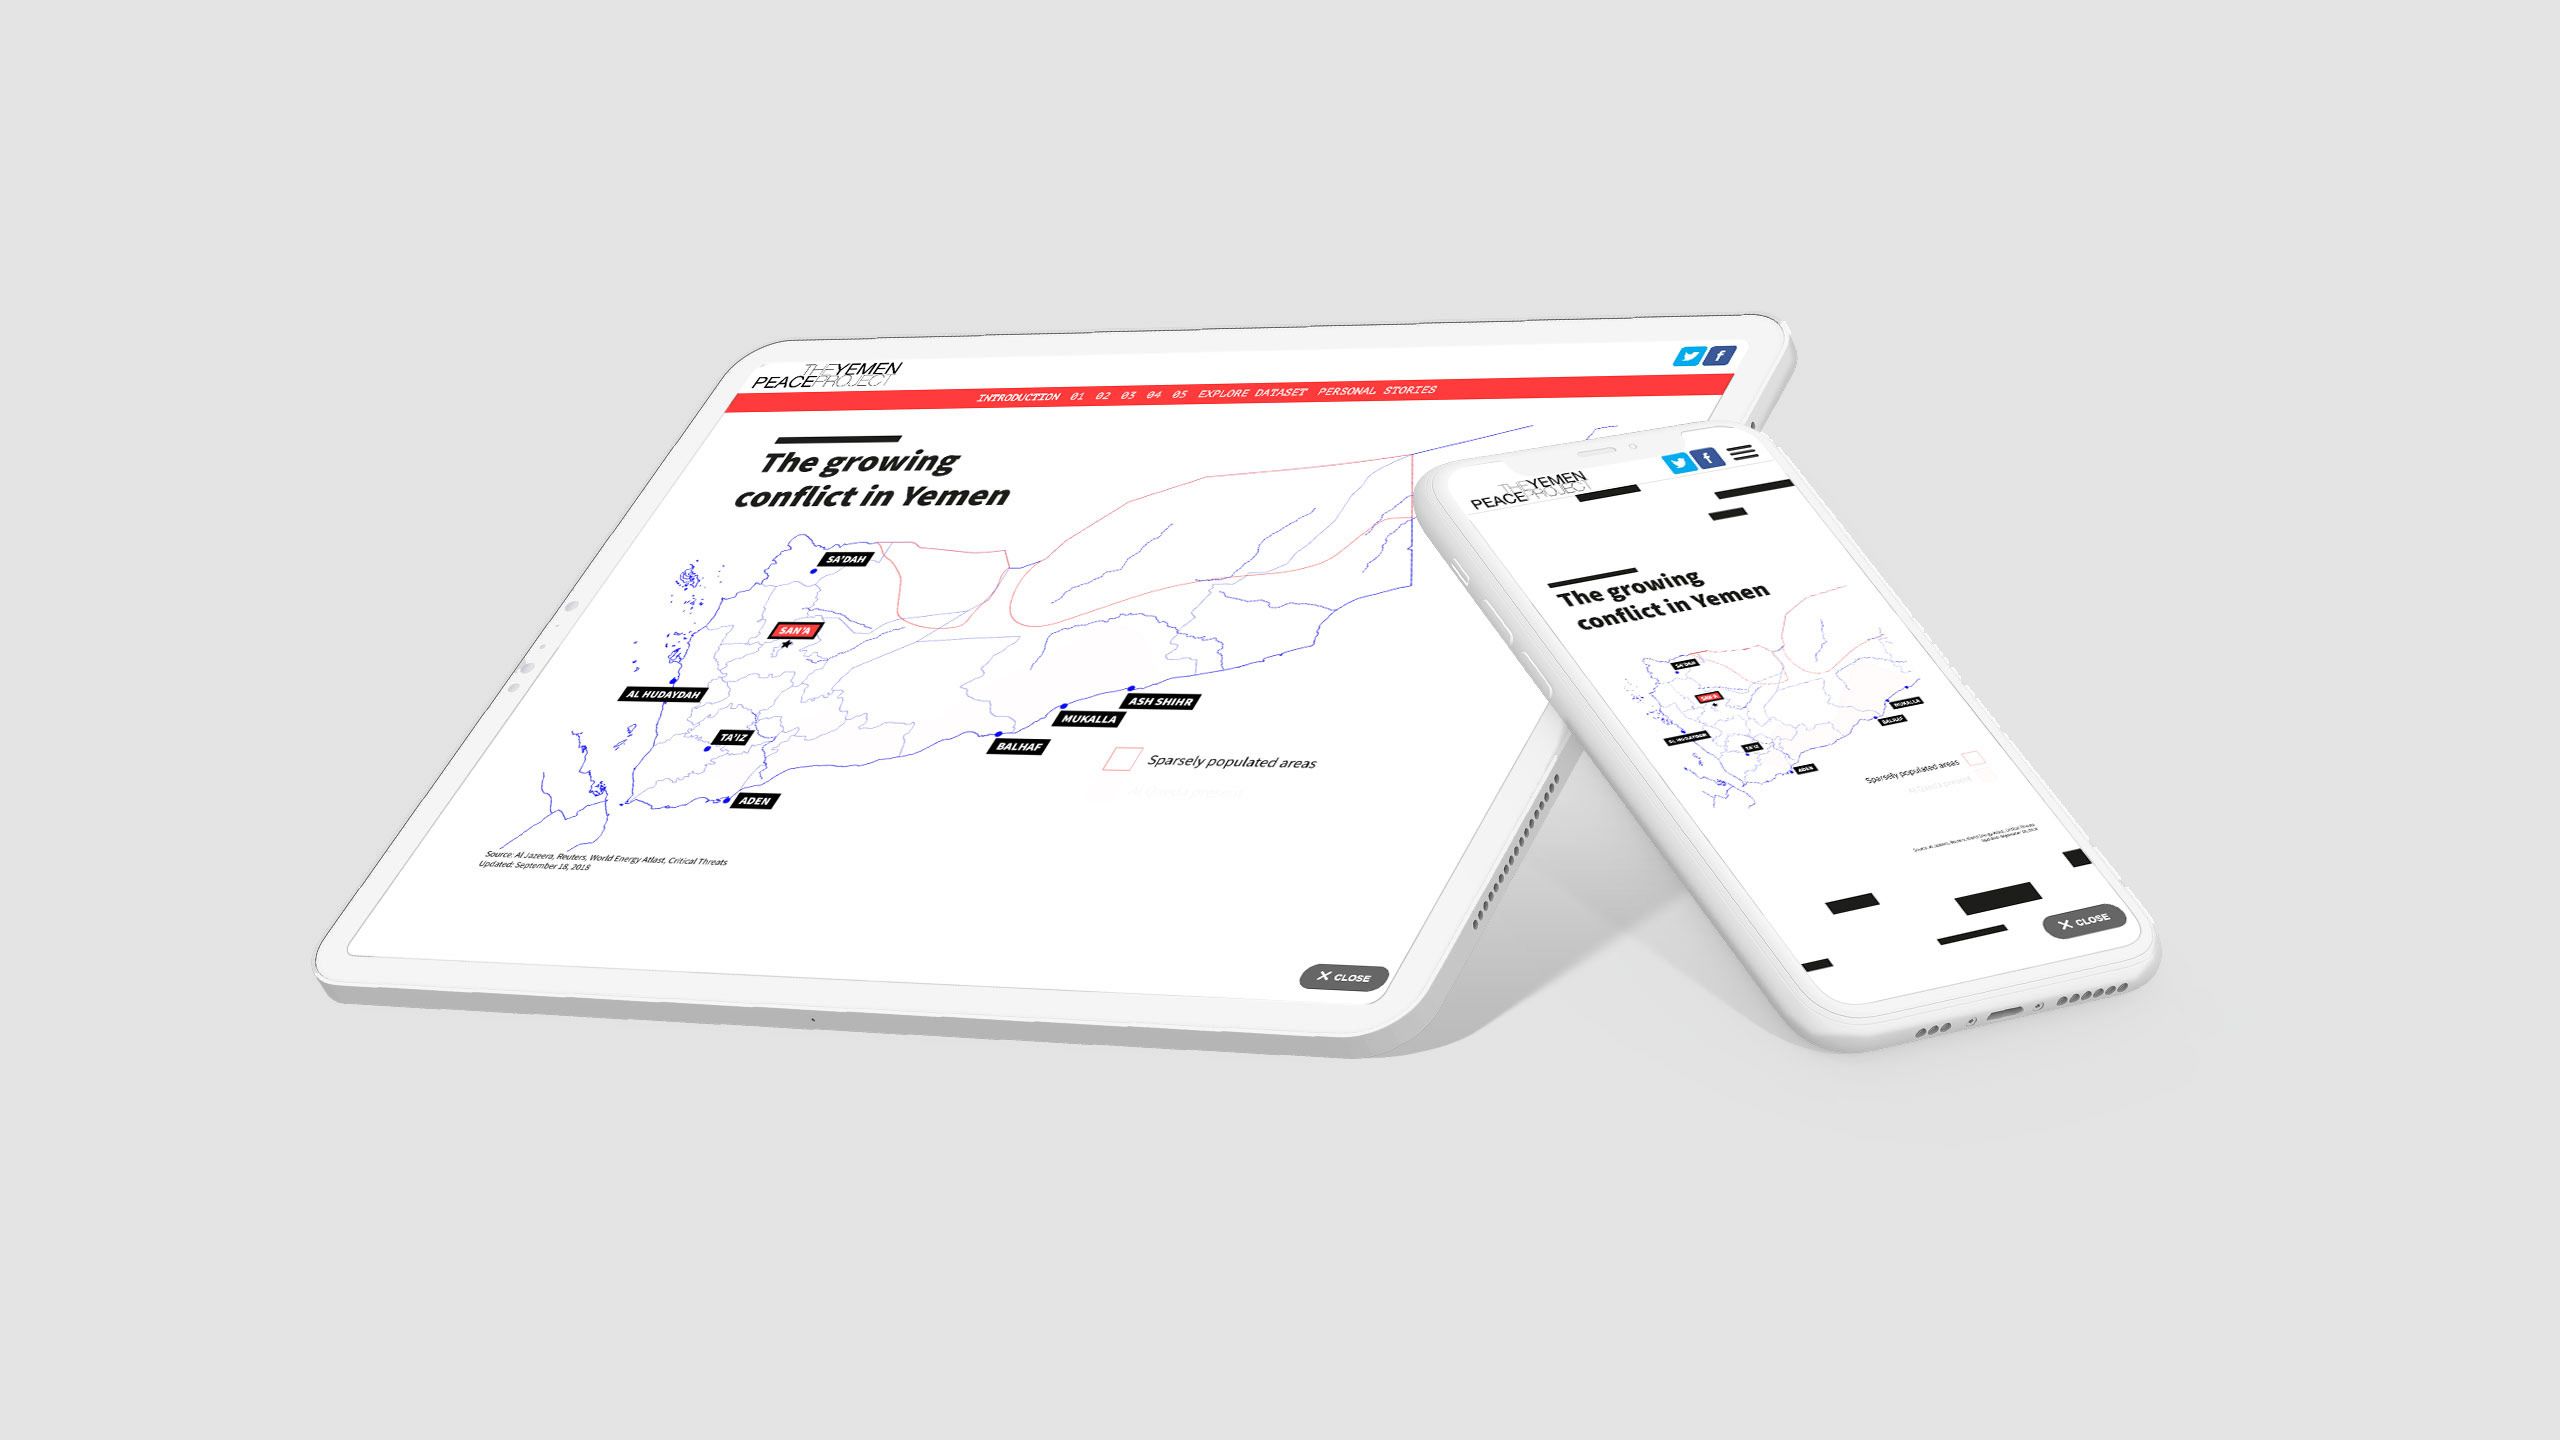
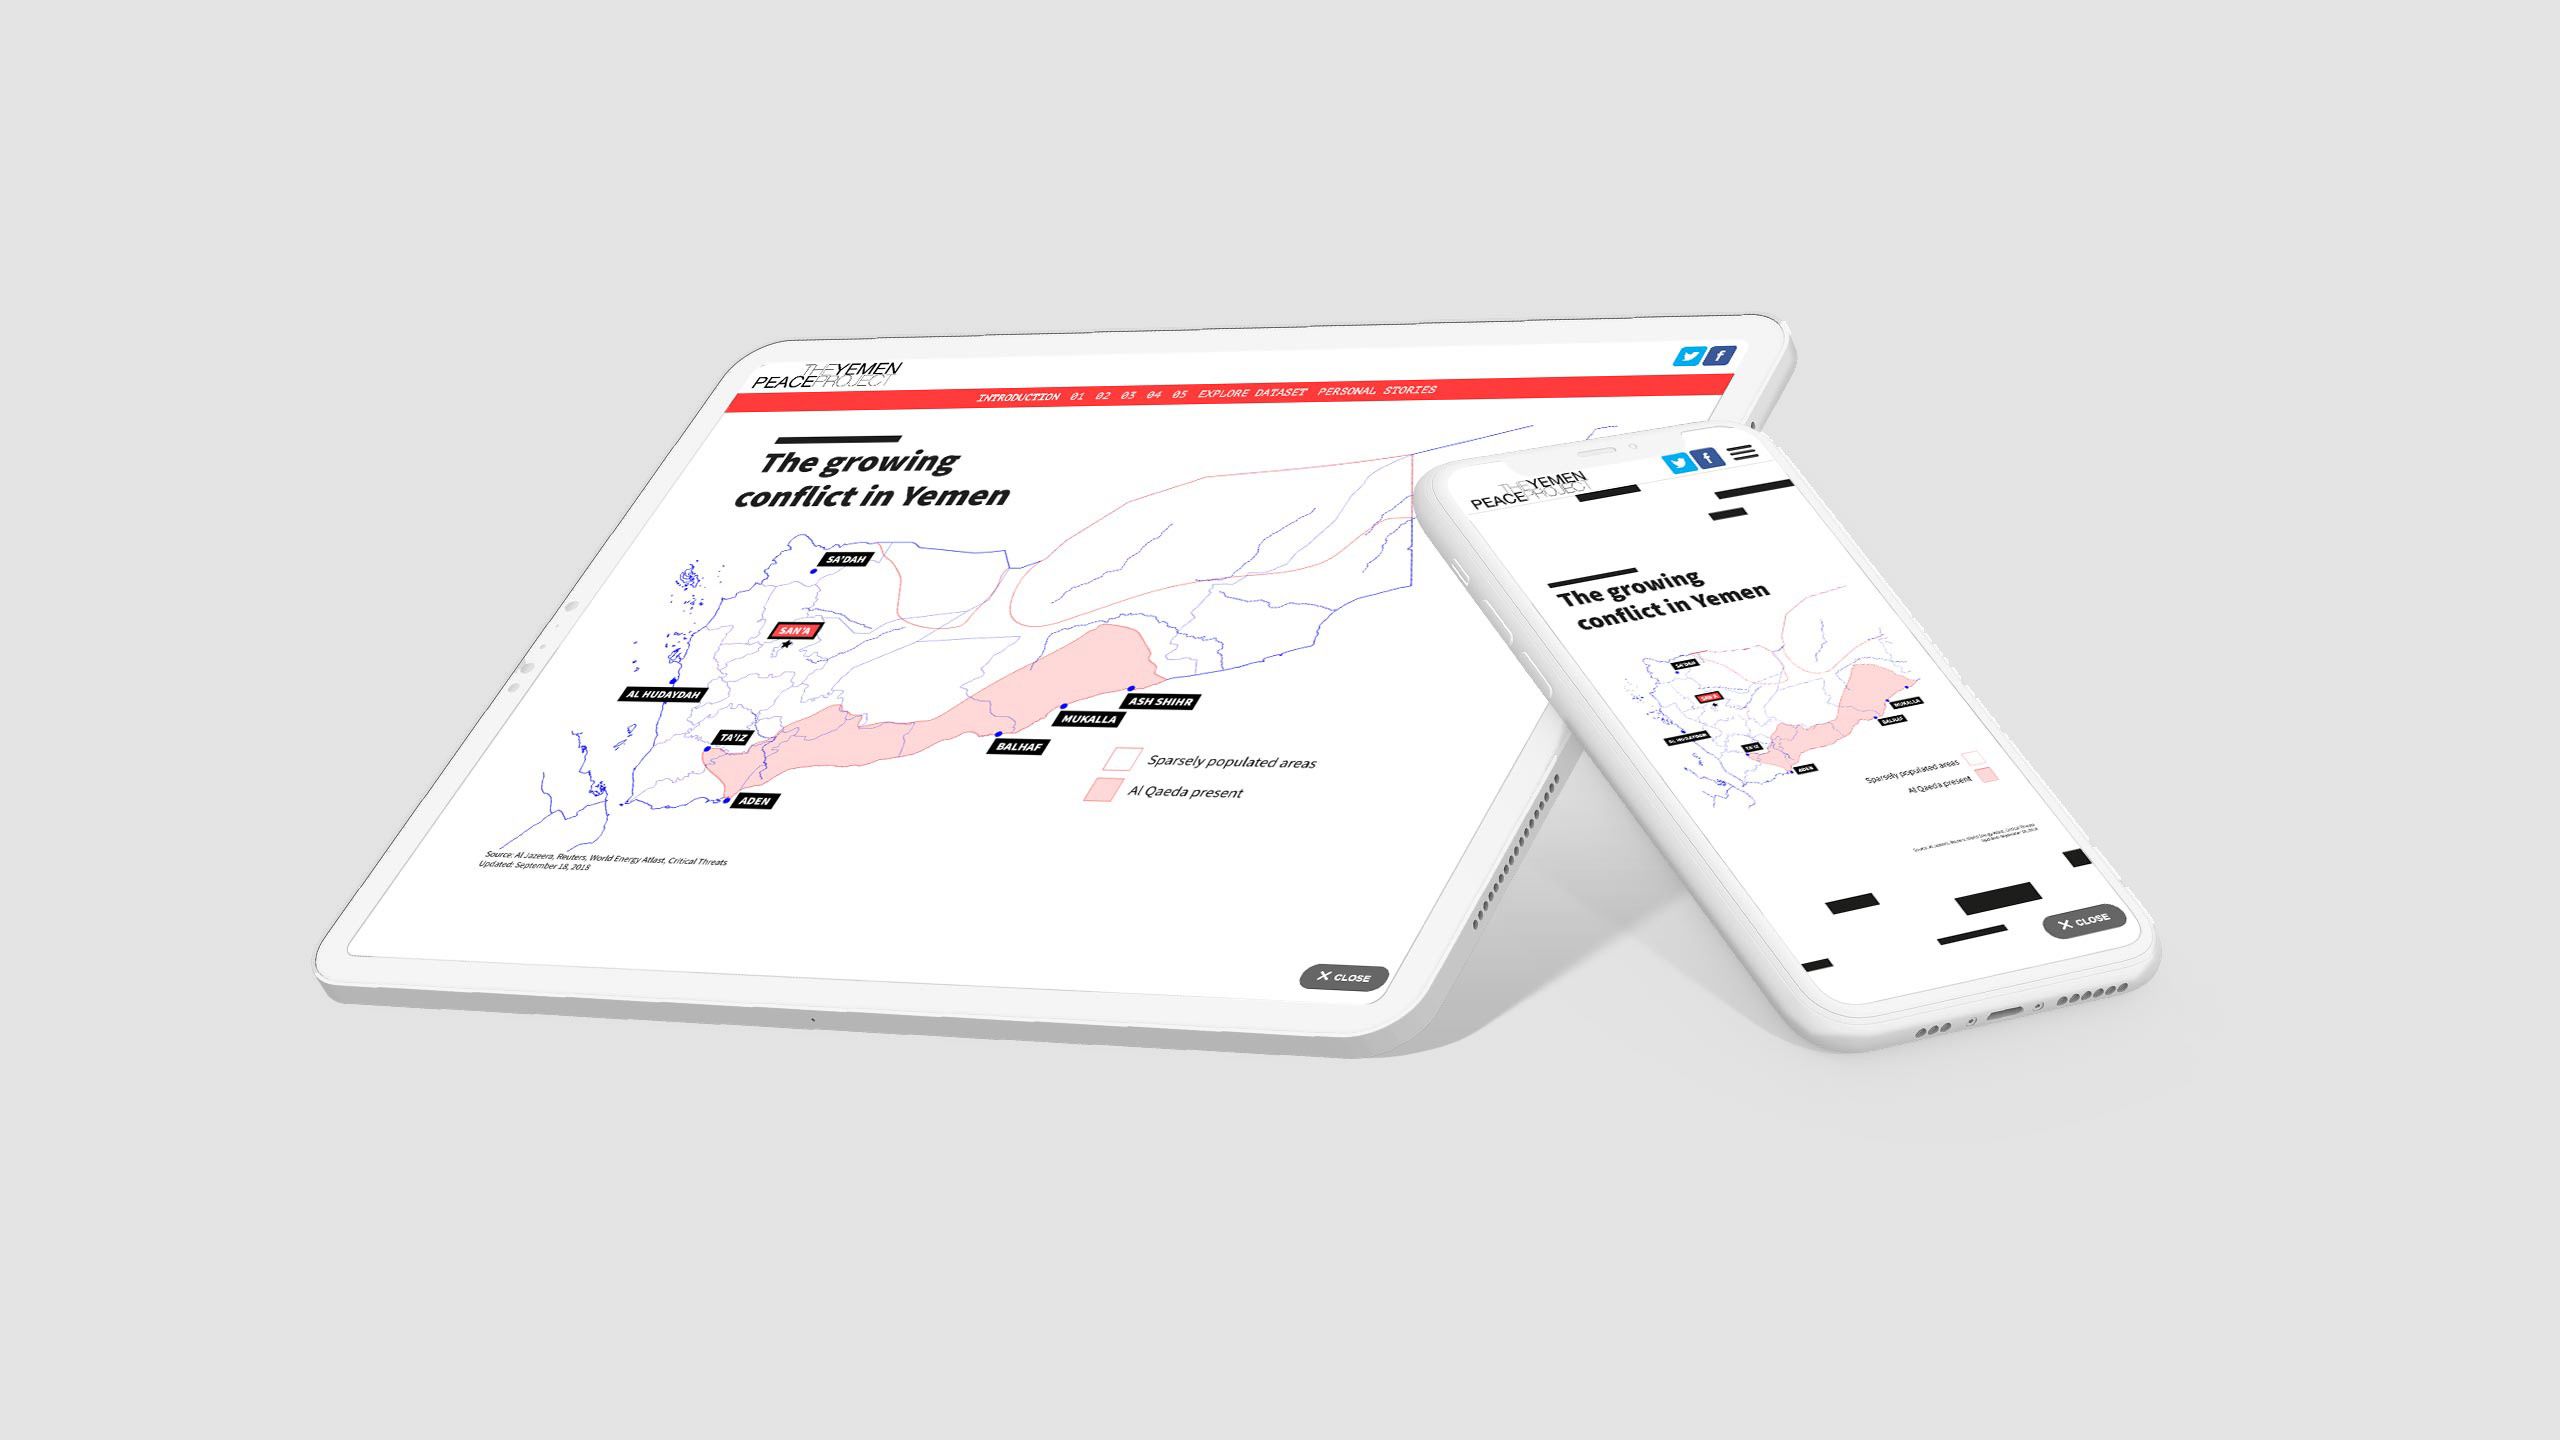
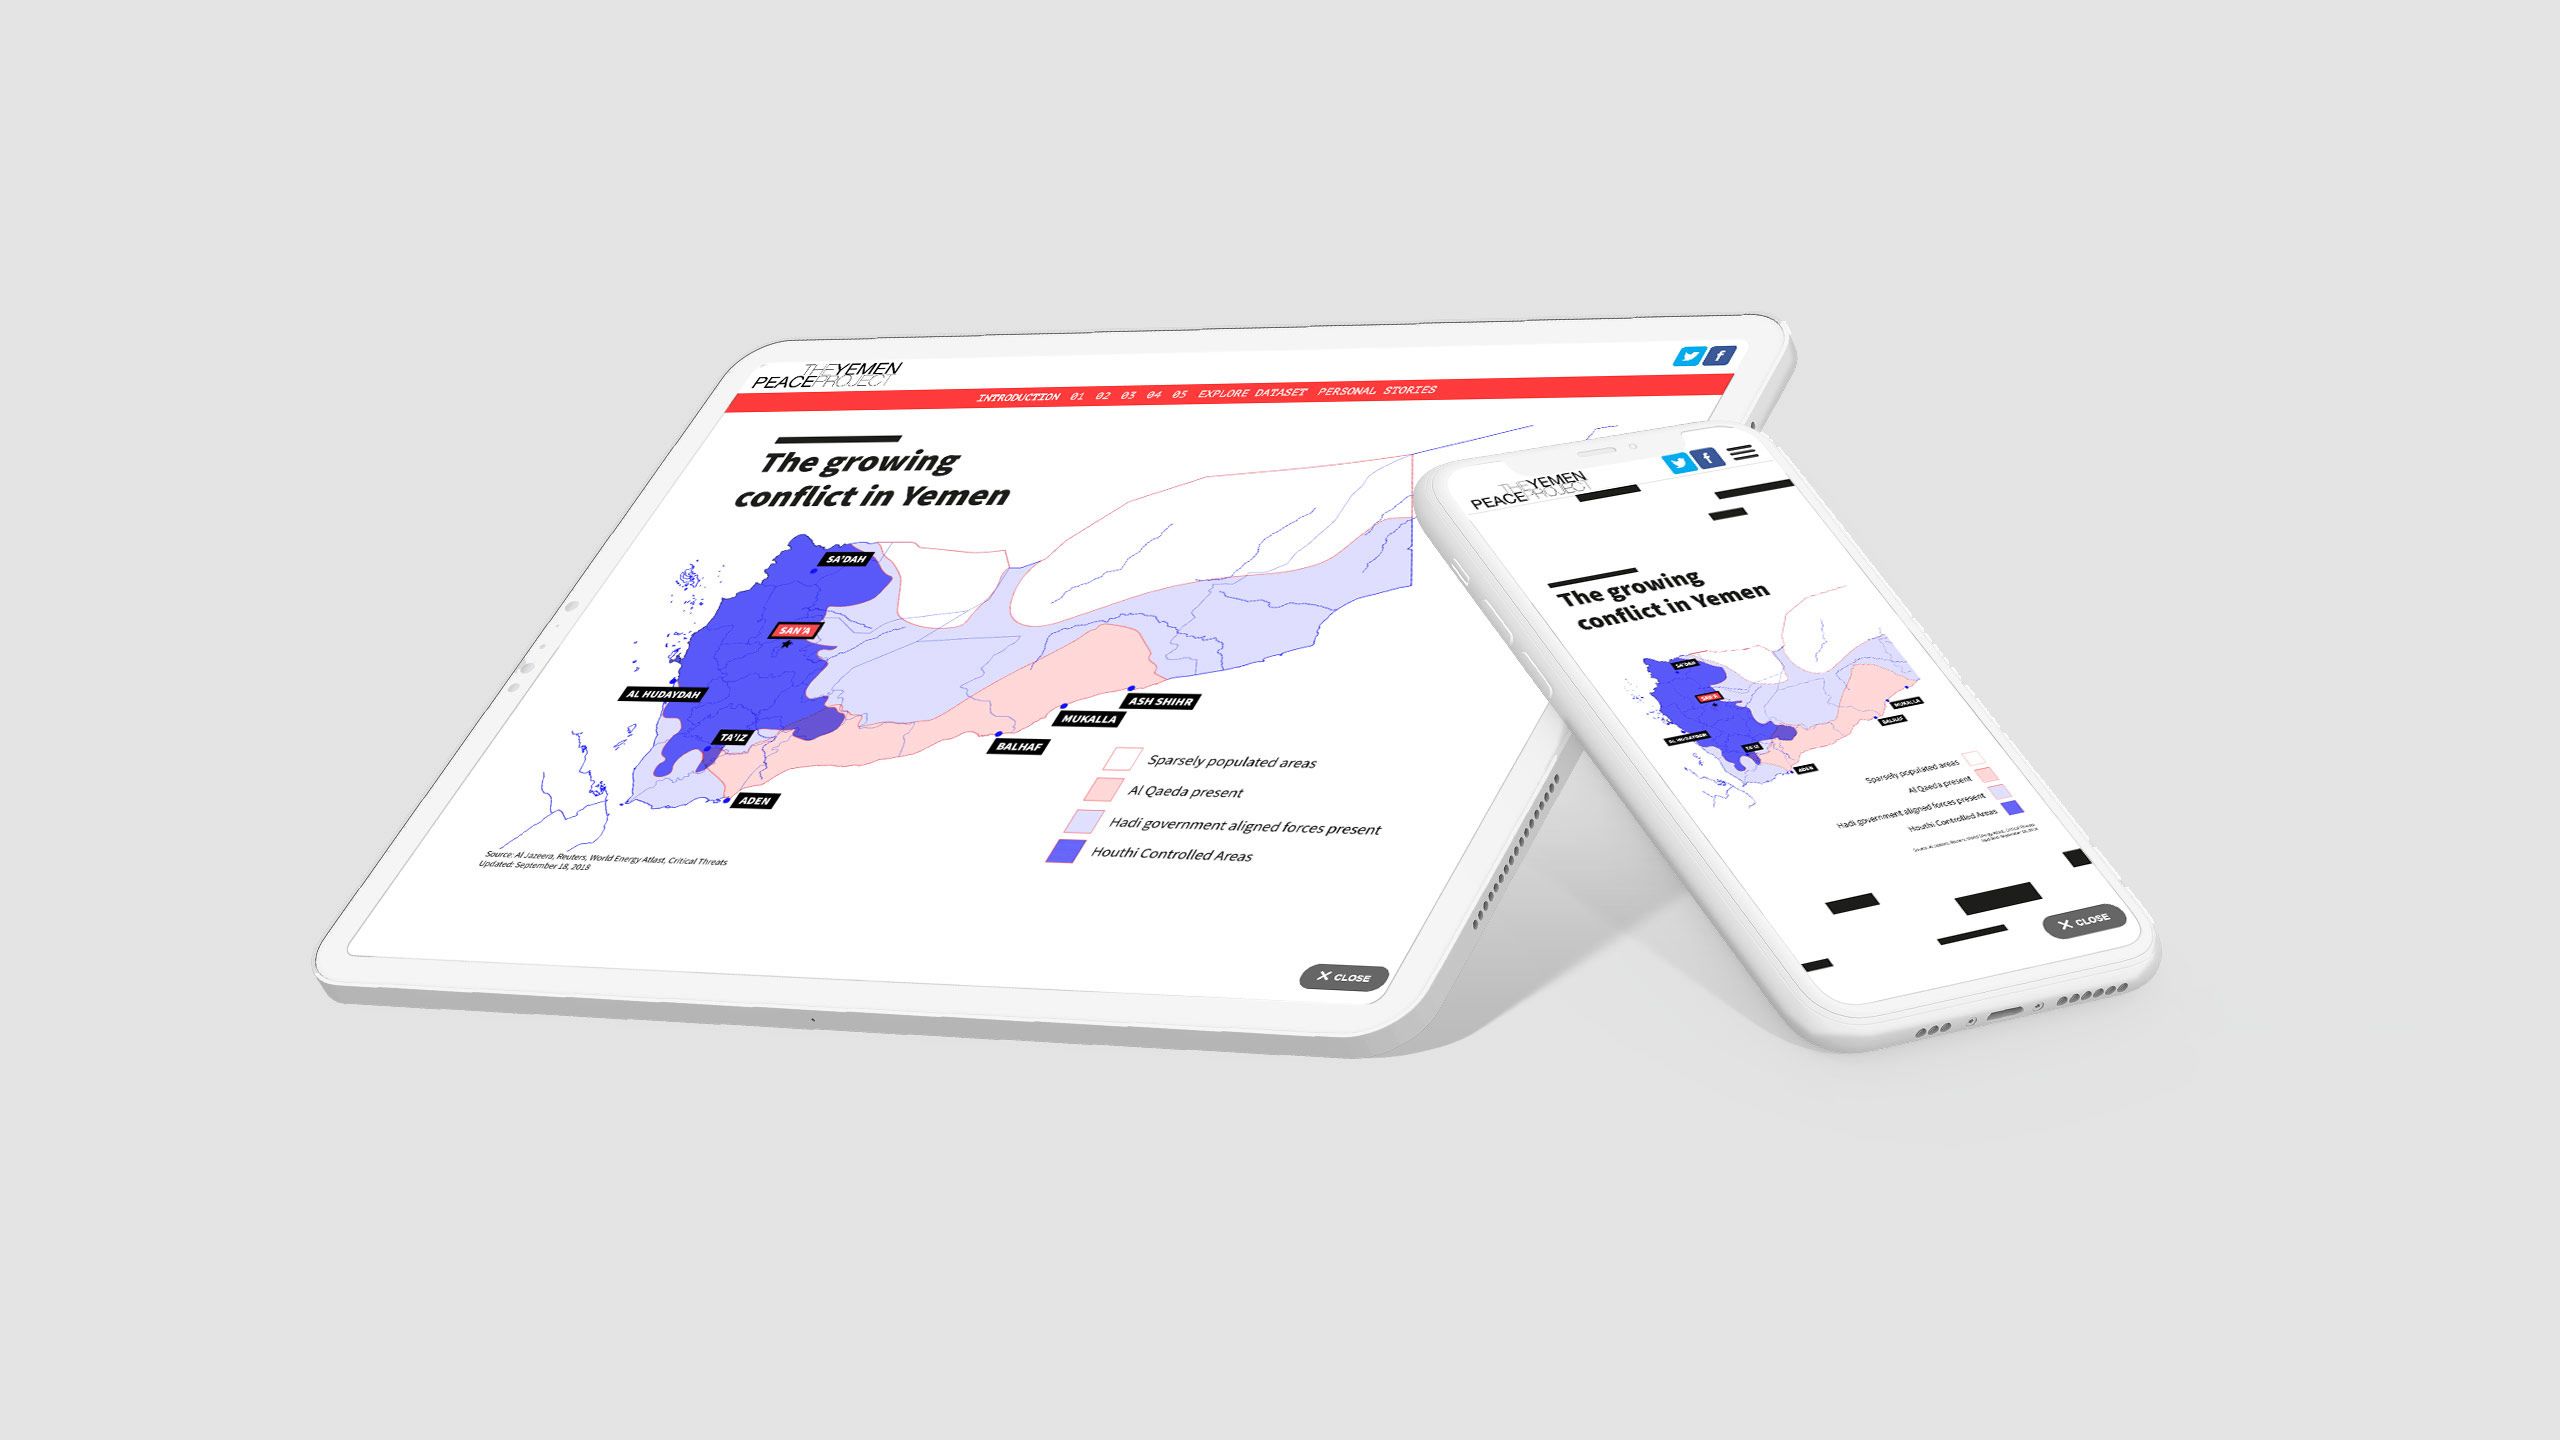
7. Use maps
If your nonprofit works regionally, then consider including a map — or maps, plural — showcasing your work. You might choose to highlight different projects your team has completed over the year, or emphasise problems or crises that your organisation is trying to address.
Embedding a custom webmap — one that readers can pan and zoom — is a compelling option, but usually requires custom development, which can get expensive.
Instead of a webmap, consider using static illustrations to create an interactive map, triggered by the scroll of the reader. This is how The Yemen Peace Project created their map of Yemen’s invisible war, built with digital storytelling platform Shorthand.


8. Showcase your community
Nonprofits are fundamentally about people, including your staff and supporters.
Too often, annual reports focus on the top of the organisation, without paying enough attention to the people on the ground. But the stories of these people — and the work they do — are typically much more compelling to readers, including funders.
One way to showcase your community is to include a rich gallery of images and video.
9. Keep it snappy
As we’ve already argued, annual reports take a village. They have many audiences and many creators. The net effect of this ‘village’, though, is that most annual reports are extraordinarily long — far too long for most people to read.
Some of this is necessary. You need a human-readable update from the leadership on the strategic direction of the company. You need to include your financials. You need some data on the work you’ve been doing. And you need human stories.
So, what to do? Rather than exclude any of these sections, we recommend keeping them as concise as possible. If your Executive Director is used to writing 800 words, see if she can get it done in 500. If the essay on that critical project is stretching into multiple pages, try and cut it in half.
Ultimately, if you keep each section slim, readers are much more likely to continue reading.
PDFs are great — for some purposes. But with the rise of digital storytelling platforms, there are simply much stronger, web-native alternatives for producing content that's as critical as your annual report.
Want to try it for yourself? Start creating now for free, or get in touch to learn about our discounted subscription plans for nonprofits and NGOs.
Create your free Shorthand account
It's the fastest way to publish beautifully engaging annual reports, donor comms, impact reports, data stories, and more.