
10 tools to create interactive maps

Content professionals — from journalists to marketers — have long understood the power of maps. Over the last five years, an increasing number of media outlets have used maps to engage their readers on everything from pandemics to weather events.


by Kimberlee Meier
by Kimberlee Meier
The problem for most web content professionals, though, is that truly interactive online maps have been incredibly expensive to produce and maintain. Expertise in geospatial data and web development is thin on the ground in most marketing teams — who typically don’t have ‘map maker’ as one of their in-house hires — which has meant that great interactive map stories have been few and far between.
The good news is that, with the rise of interactive mapping tools, teams can now produce maps and integrate them into their content—even on a small budget or without coding skills.
In this guide, we’ll cover:
- what an interactive map is
- how to make an interactive map, and
- 10 tools to make interactive maps, including:
Let’s get started!
Start creating with Shorthand
It's the fastest way to publish beautifully engaging digital magazines, reports, internal comms, and more.


What is an interactive map?

An interactive map is a form of data visualisation that uses interactive features, such as Google Maps-style dragging and zooming, data points, overlays, statistics, and other information to keep a reader engaged.
Interactive maps are different to your average static maps as they allow the reader to zoom in and out and click on integrated links. This enables content creators to grab the reader's attention and get them more engaged with the story.
Unlike traditional (or 'static') maps, interactive or dynamic maps can handle large data sets of geographic information which can be updated in real-time. They can also be customised to different map styles.
Check out our roundup of interactive map examples to learn more.
Why interactive maps are better than traditional, static maps


You may be scratching your head thinking—why would anyone choose to use static maps instead of interactive maps?
It comes down to money.
Until recently, producing interactive maps required GIS (that’s Geographic Information System) software. This software can be very expensive and is generally aimed at enterprise companies with large budgets. Even in those companies, its primary use case is almost never marketing or communications.
Even free tools like QGIS require expertise to run, and will generally be too complex for most marketing and communications teams.
But as I said in the introduction, thanks to the rise of more affordable and accessible mapping platforms, apps, and tools, that's all changing.
How do I make an interactive map?

The type of interactive map you need will come down to what you're using it for.
Some interactive maps use datasets to make a story interesting, while others use scrollytelling and striking design to draw your reader in.
Here are some points you need to consider
- Data. What will your map show? Interactive maps can show points, lines, and polygons indicating a specific place on a background basemap, such as a satellite image.
- Design. What do you want your map to look like? Do you want it to be produced with your brand colours? Do you want it to fit into your blog and match the other web design elements in your content?
- Production. How will you build your map? Here is where you get to decide how interactive and impressive you want your map to be. Developing and maintaining a truly interactive map will generally require a developer or GIS resource, so keep that in mind for your budget.
- Distribution. Where will you publish your map? Will you be able to share it on your website and social media channels? Will you want to embed your interactive map into a content platform like Shorthand so your audience can interact with it?
No matter what you want your interactive map to do, you'll need a specialist tool to build one. Below, we've picked 10 of the best tools that will help you to design the perfect interactive map for your content.
10 tools to make interactive maps

1. Mapbox
Mapbox is an interactive map tool that’s used by some huge names like the New York Times, BMW, and Instacart.
With Mapbox, you can create your own custom map, or use templates to build a gorgeous interactive map. Some of the best Mapbox-powered maps offer a fantastic user experience.


If you’re technically inclined, it's also got a ton of features like a Smart Directions API and GL JS built-in functions so that you can build maps based on geospatial data.
The only drawbacks to Mapbox are its complexity and cost.
If you have developer knowledge and can trawl through the tool's technical documentation, you may be able to get away with the free plan. If you need help from Mapbox over email support or a product expert, the costs can run around $500/month (minimum!)
Pricing:
Free developer plan available. Paid essential plan starts at $50/month.
2. ArcGIS StoryMaps
If you need a tool to combine large, complex datasets into an interactive map—ArcGIS StoryMaps could be your answer.
The software allows you to add text, images, photos and videos to customisable maps and store them in the cloud. From there, you can publish them or integrate them into your content to help tell your story. If you want to create a map quickly, the tool also has an express maps feature that builds custom maps using existing ArcGIS web maps and web scenes.
Once again, this all comes at a cost. ArcGIS StoryMaps' pricing starts at around $900/year, and experience using a GIS tool is a must. This is likely to make StoryMaps a non-starter for nearly all marketing, communications, and media teams.
Pricing
Creator plans start at around US$850/year with 500 credits. Professional Standard plans start at just under US$3000 per year.
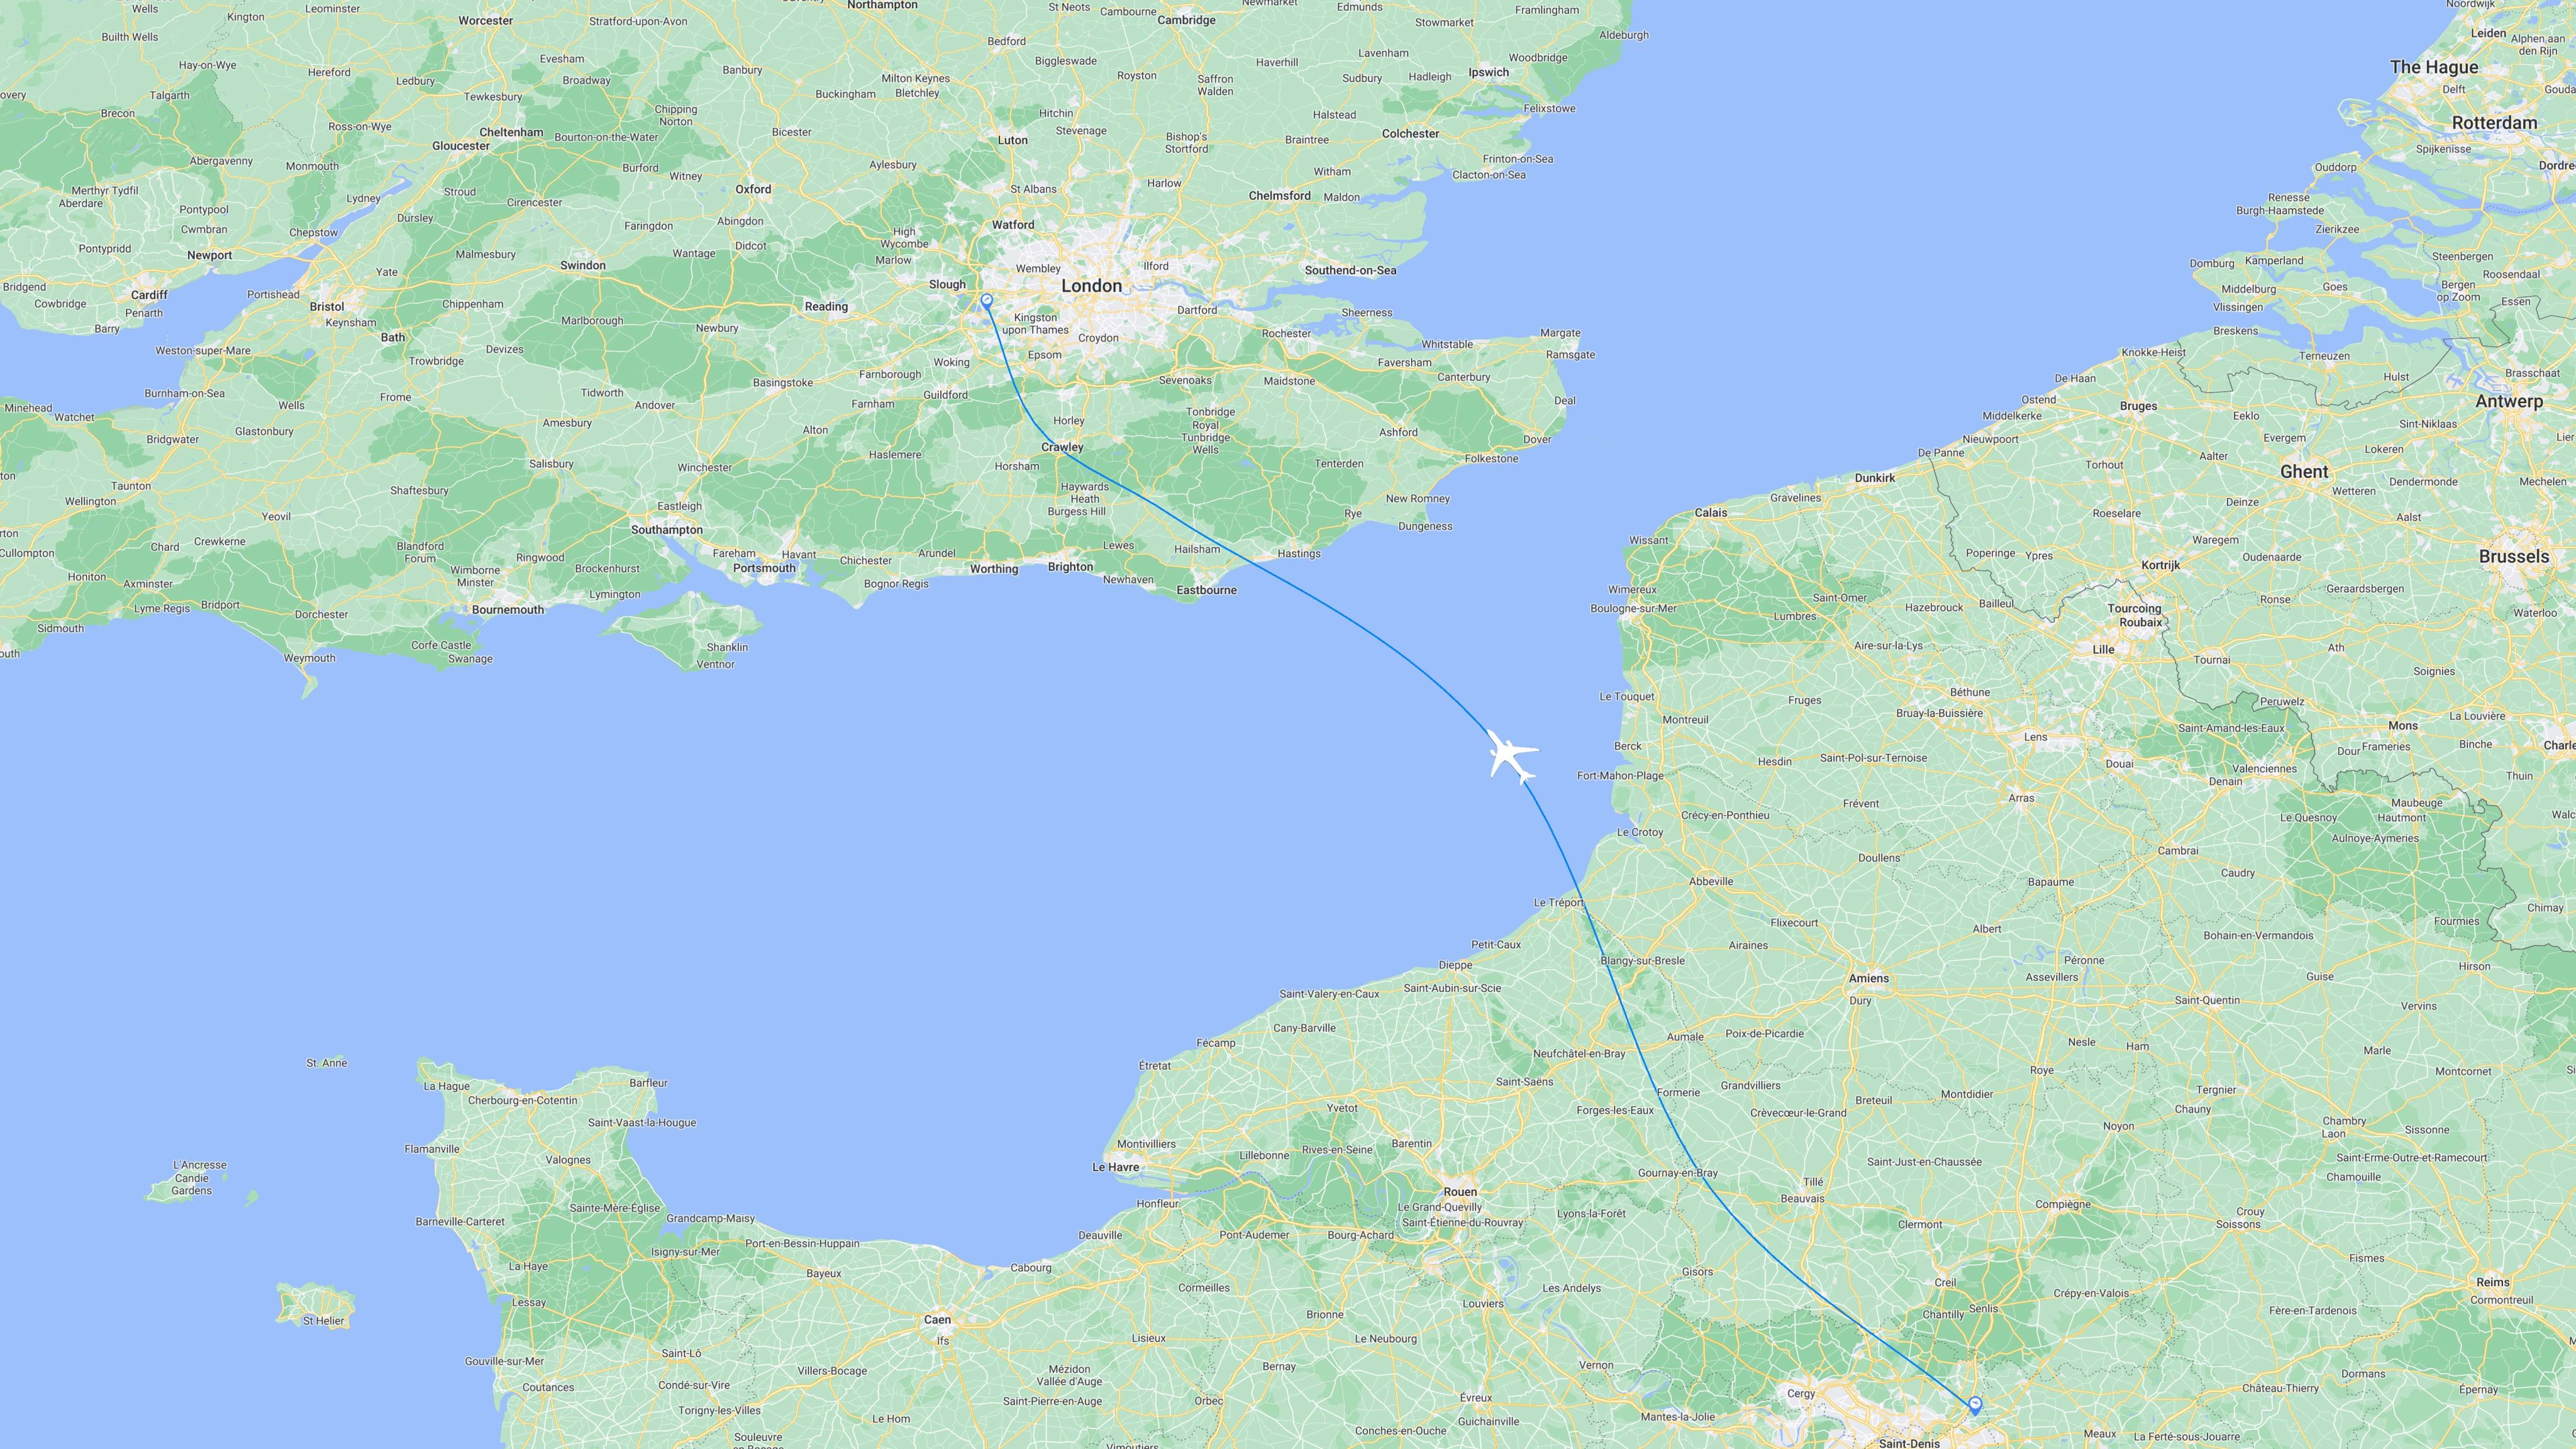
3. Google
An interactive map tool list wouldn’t be complete without Google.
For a while, the Google Maps API powered an astonishing number of community maps across the web. And then, in 2018, they announced a price increase—or ‘insane price hike’, depending on who you talk to—that meant many smaller users were paying over 1400% more per month. Suffice it to say, this explains why maps on older websites often look a little broken.

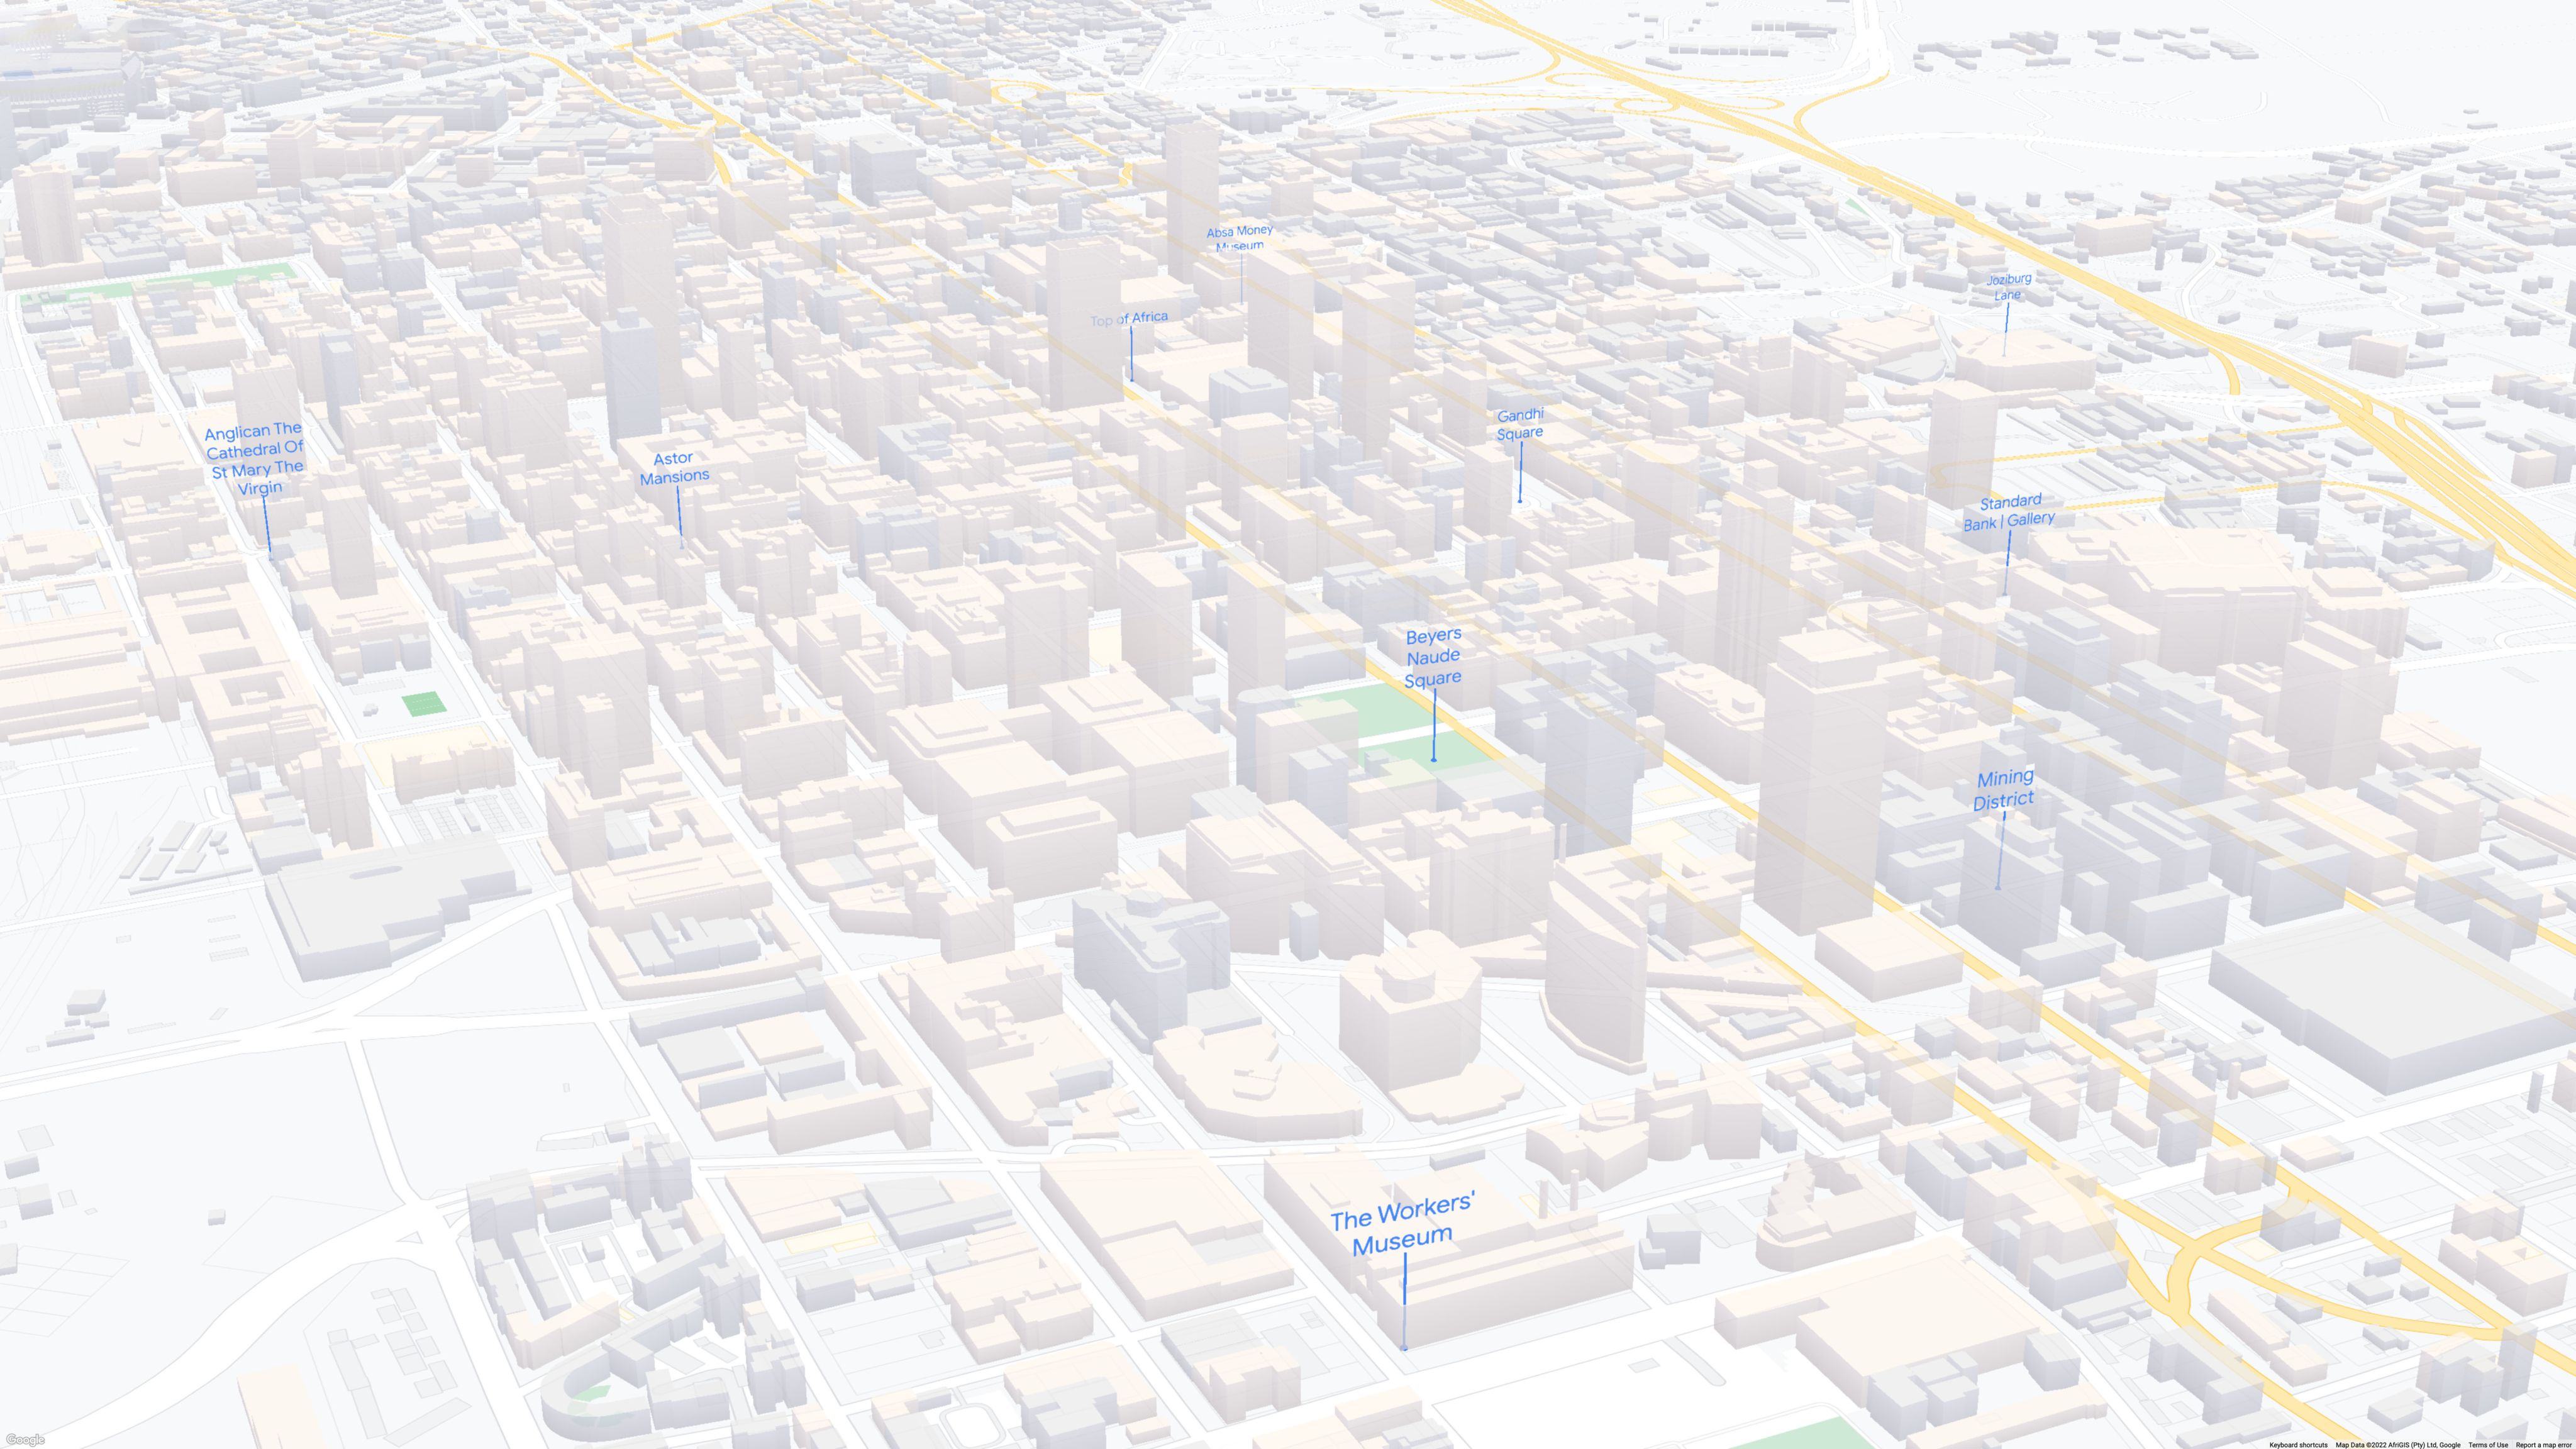


Most of us use Google Maps all the time as a GPS or to find restaurants. The Google Maps Platform looks similar, but it's geared towards developers who want to create and embed vector maps.
The maps live in the cloud, and once the Map ID is in place, it can be edited and updated in real-time. Unlike some of the other tools on our list, the design and look of the interactive map can be done even if you don't have coding skills. Then, you can easily change elements such as roads, buildings, bodies of water, and points of interest.
Even if you are new to map tools and using features like APIs, Google has built an extensive tutorial library that you can use to teach yourself. All you need to get started is your Google Account.
Pricing:
Depends on usage and scale. Here is a guide.
4. StoryMapJS
StoryMapJS is a free interactive map tool developed by Northwestern University in the United States.
It may look a little old school, but it's easy to use. Thanks to Google Drive and Dropbox integrations, creators can drop images into StoryMap and build interactive maps using slides.
You can then add a location and text description to tell your story and change each slide's branding to match your branding.
StoryMap can also pull in media from other sites like Twitter, Flickr, YouTube, Vimeo and Google Maps to help you create maps instantly.
Once it’s ready, StoryMap will generate an embed code you can use to link the map to your website or social media channel.
Pricing
It’s free!

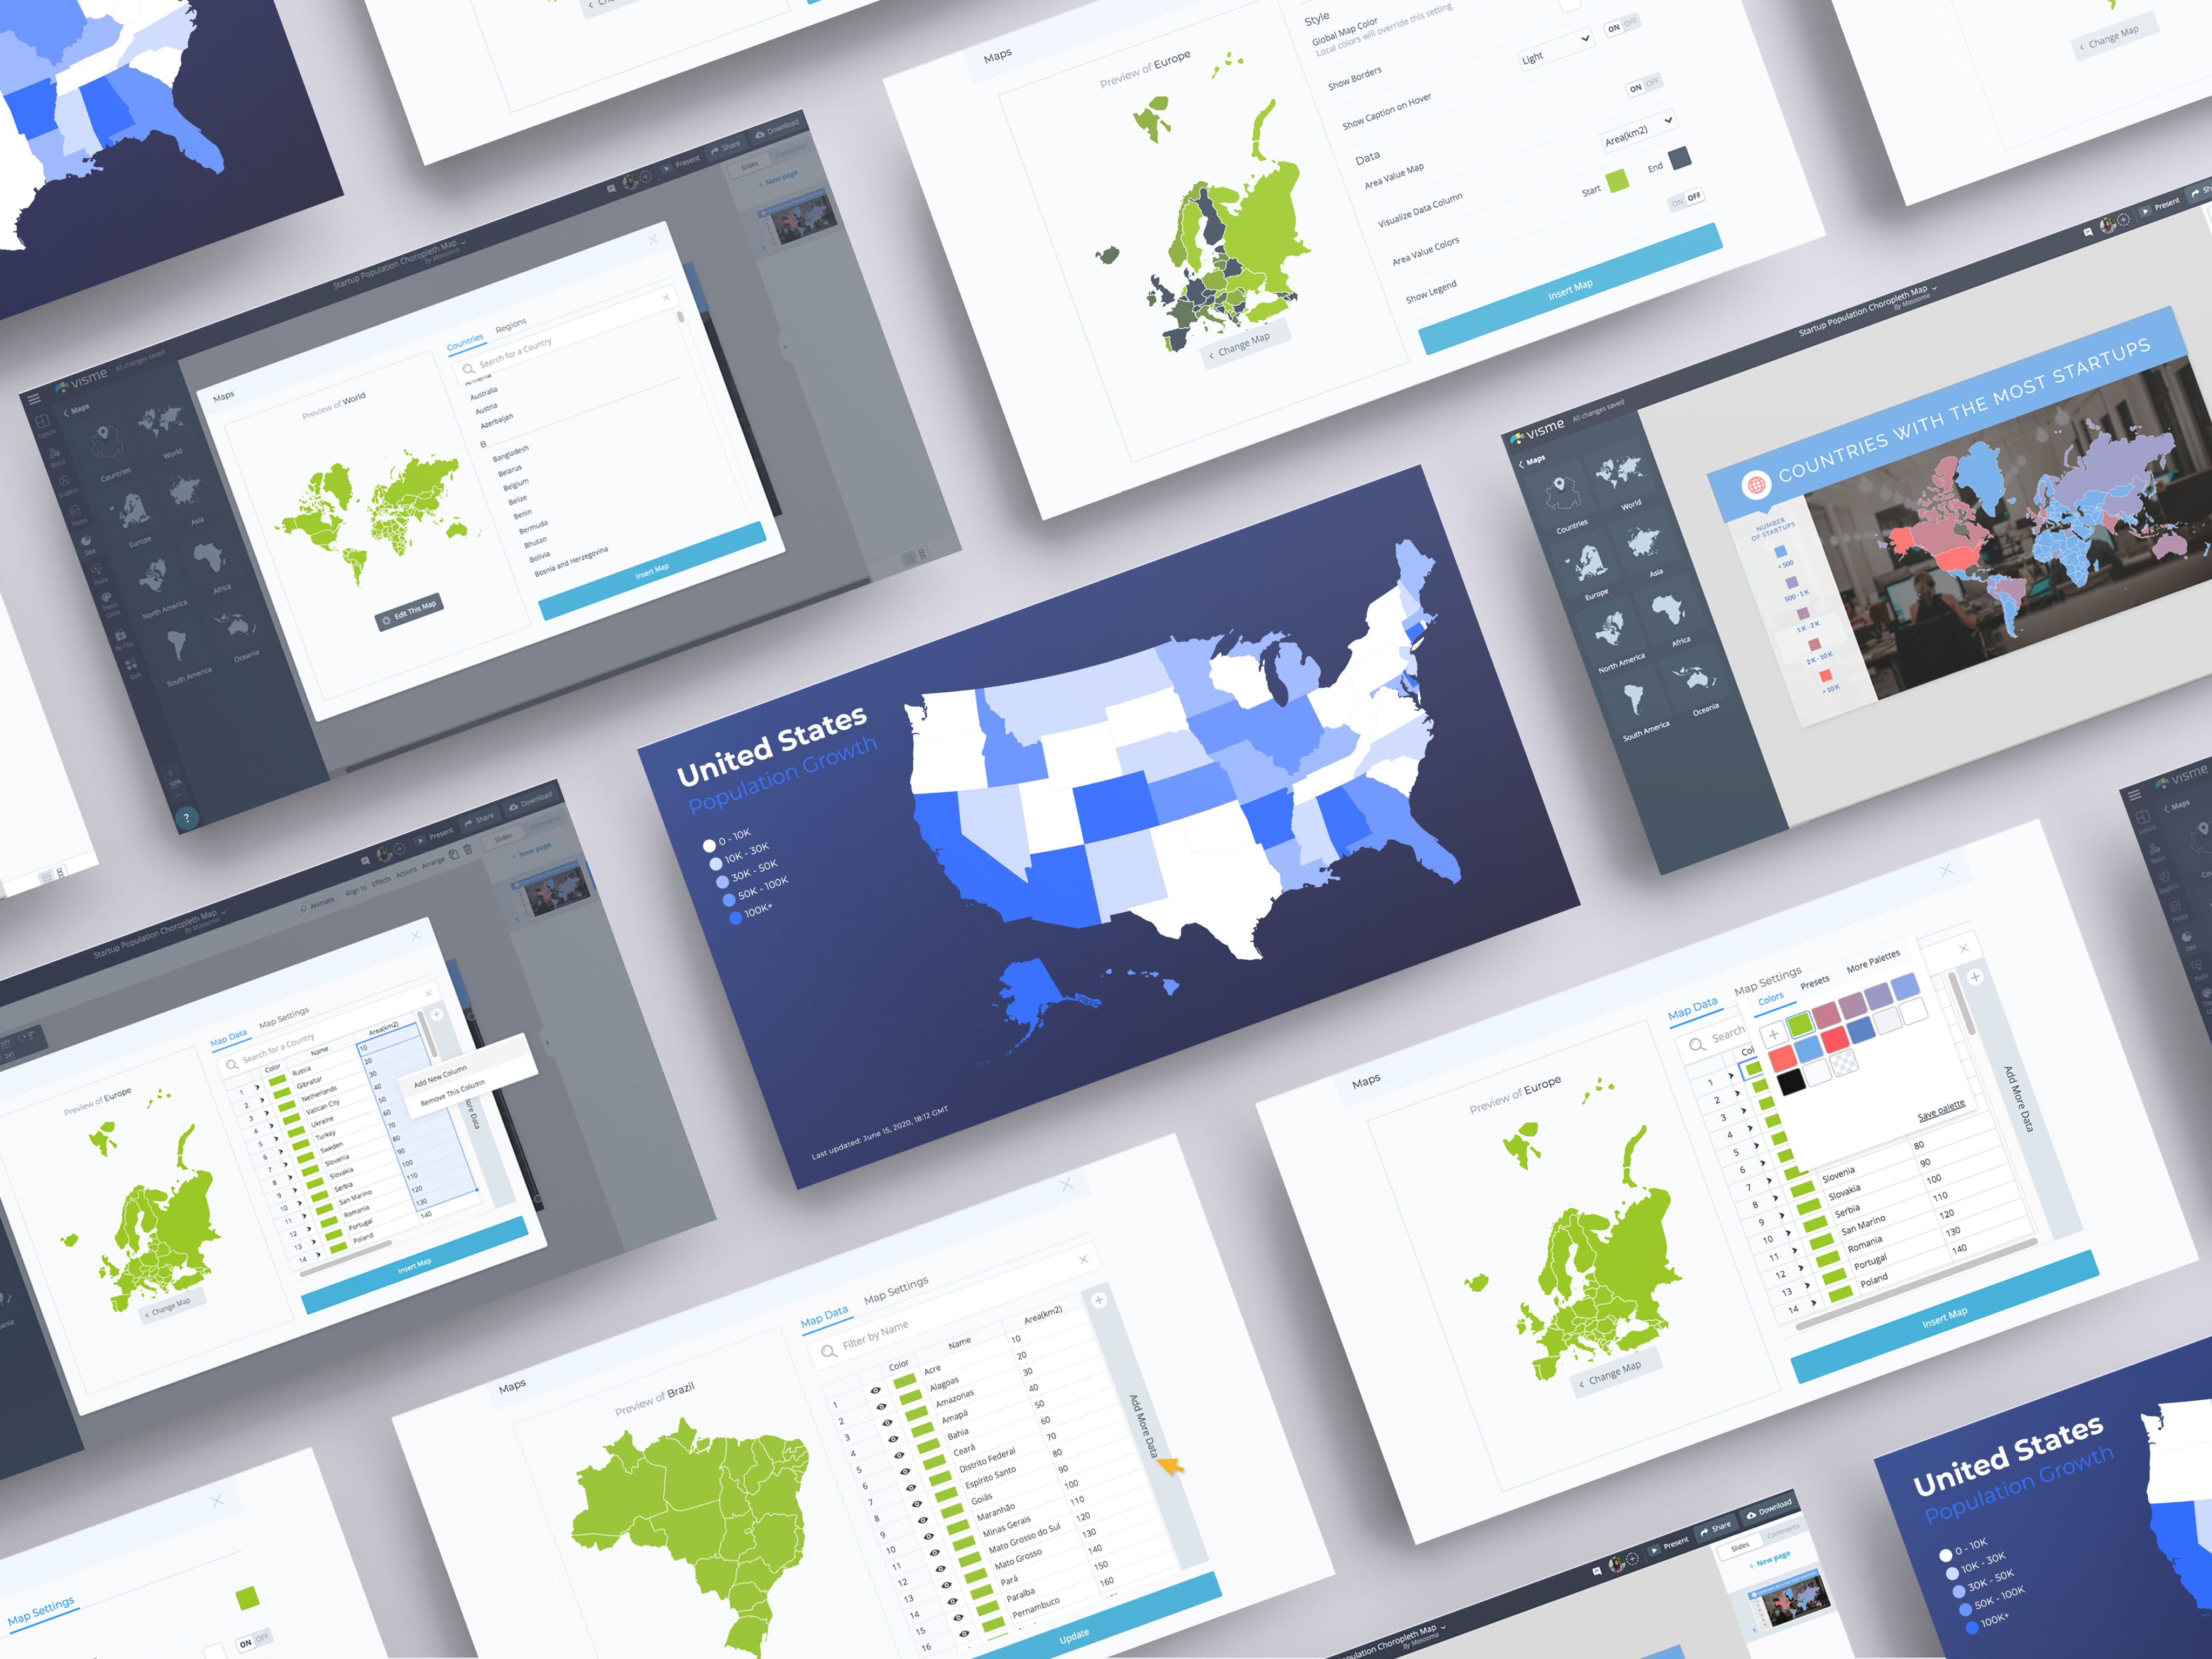

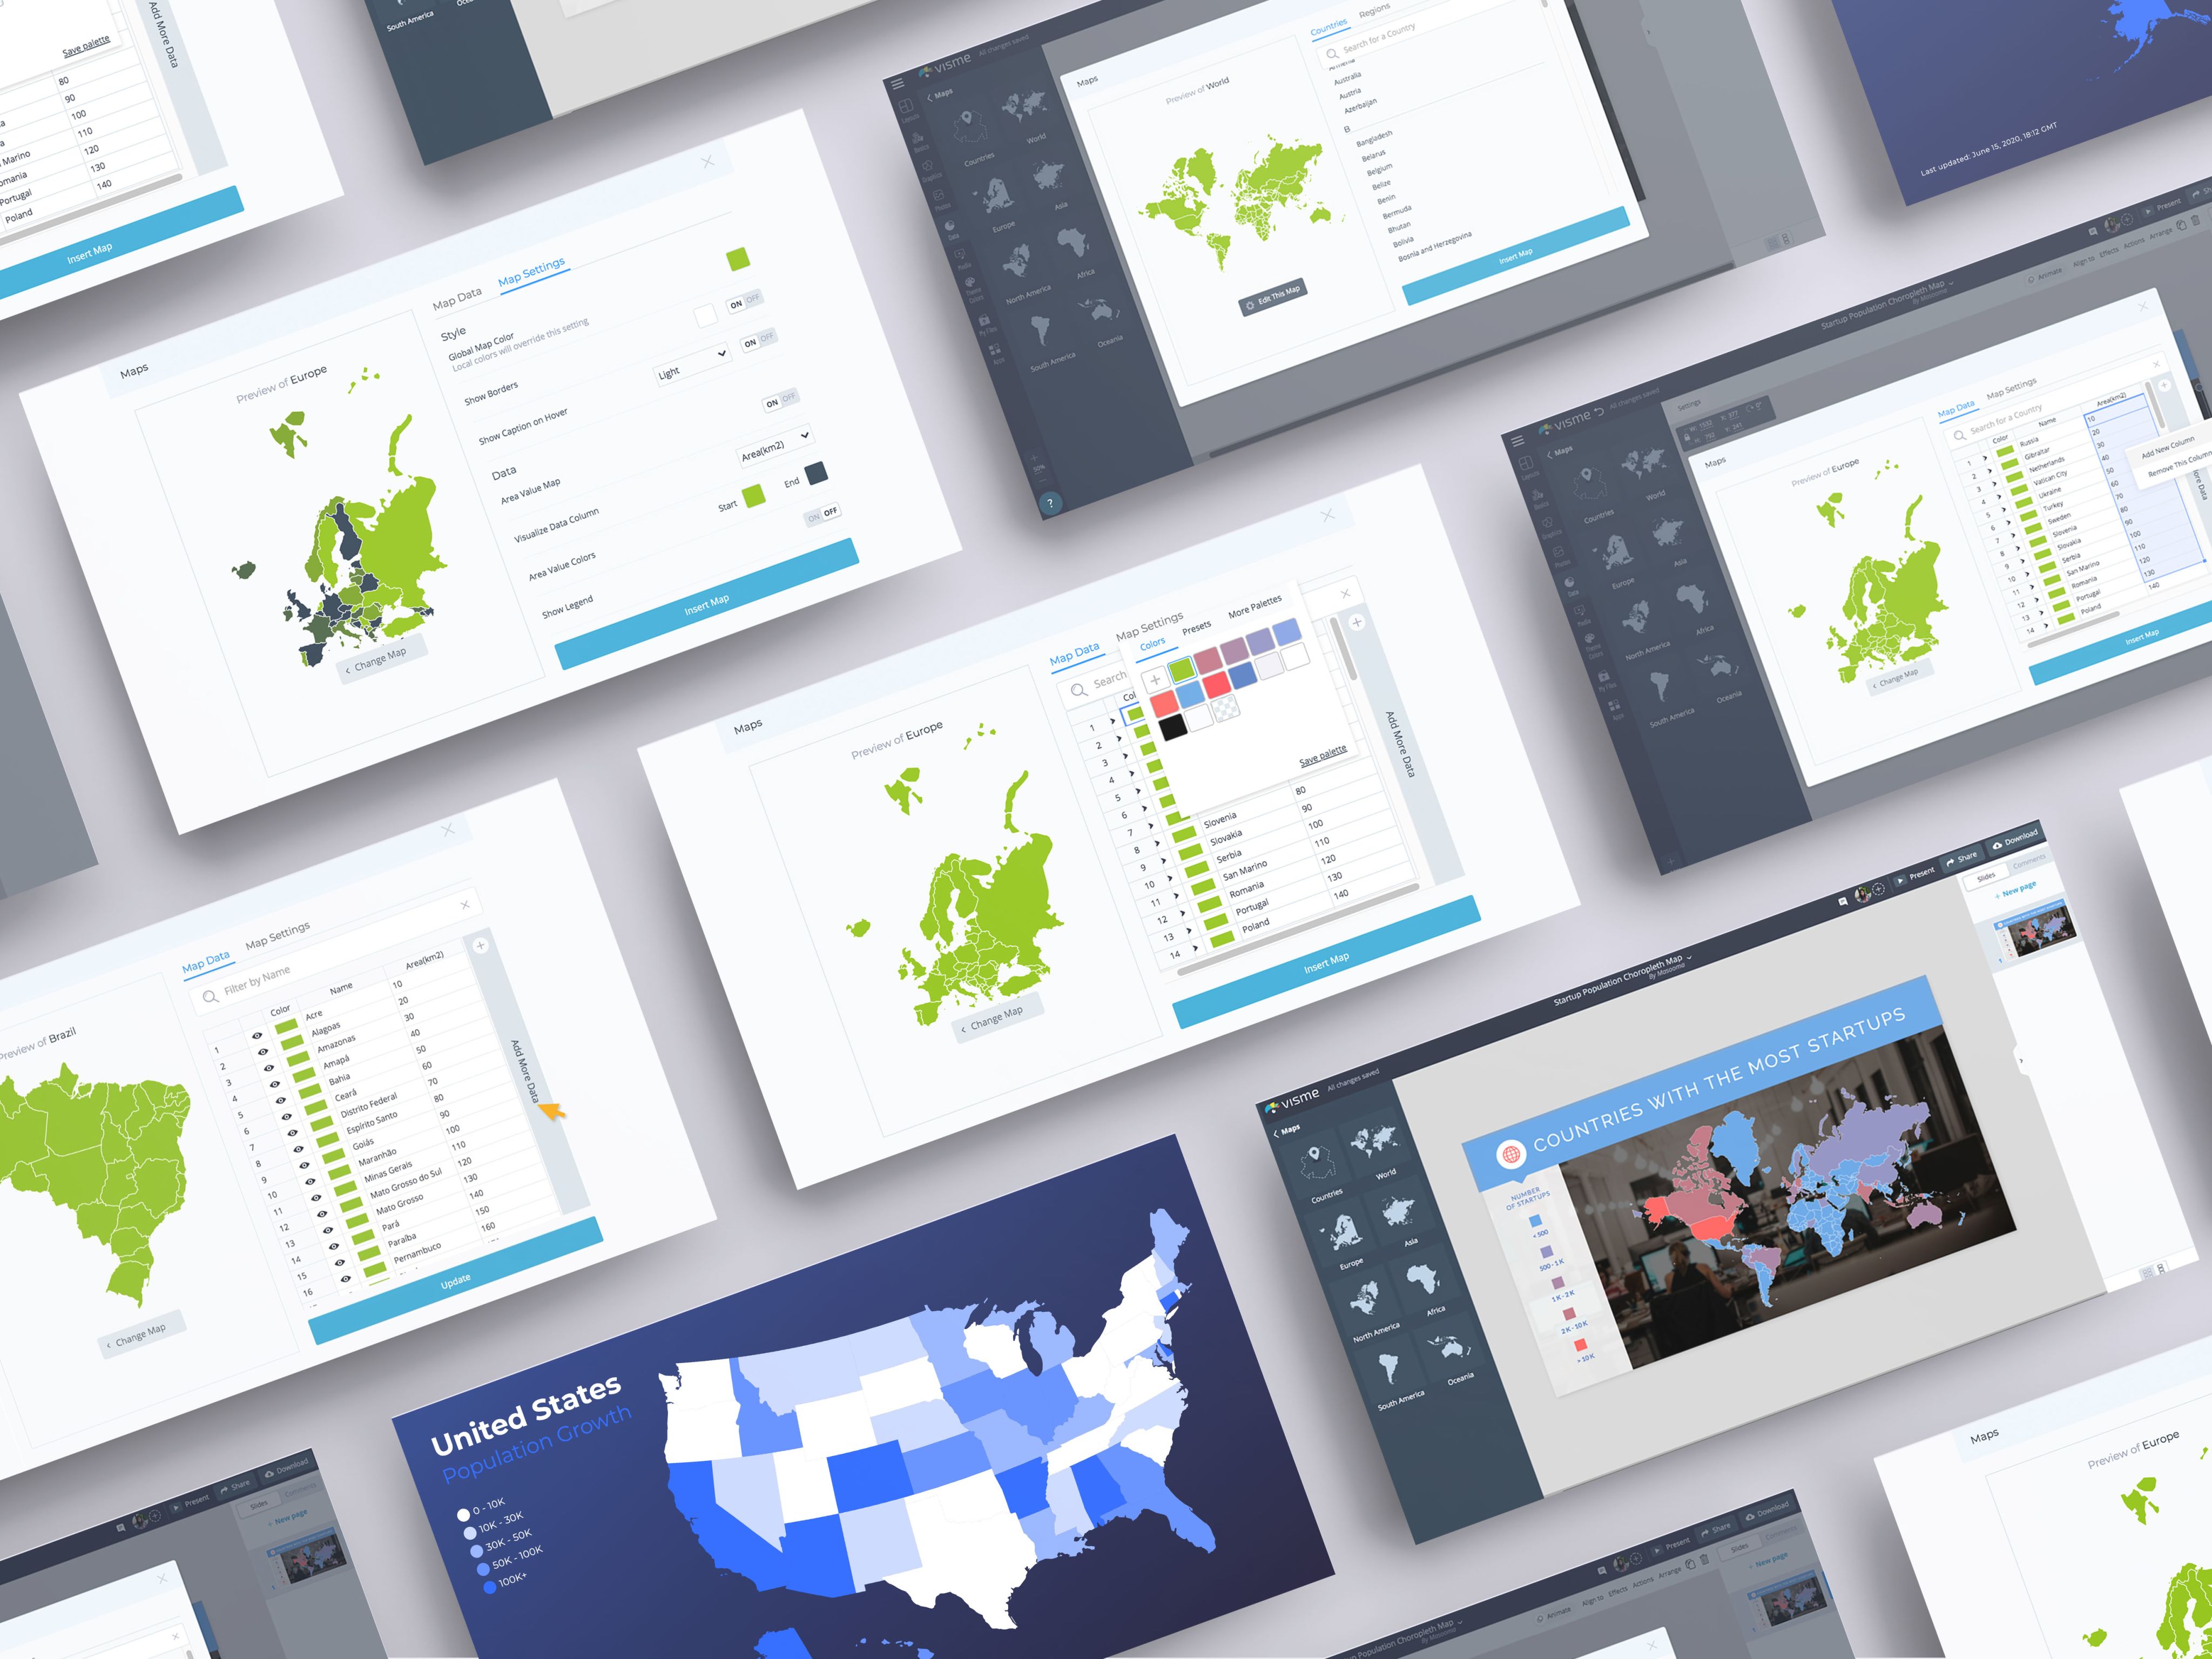
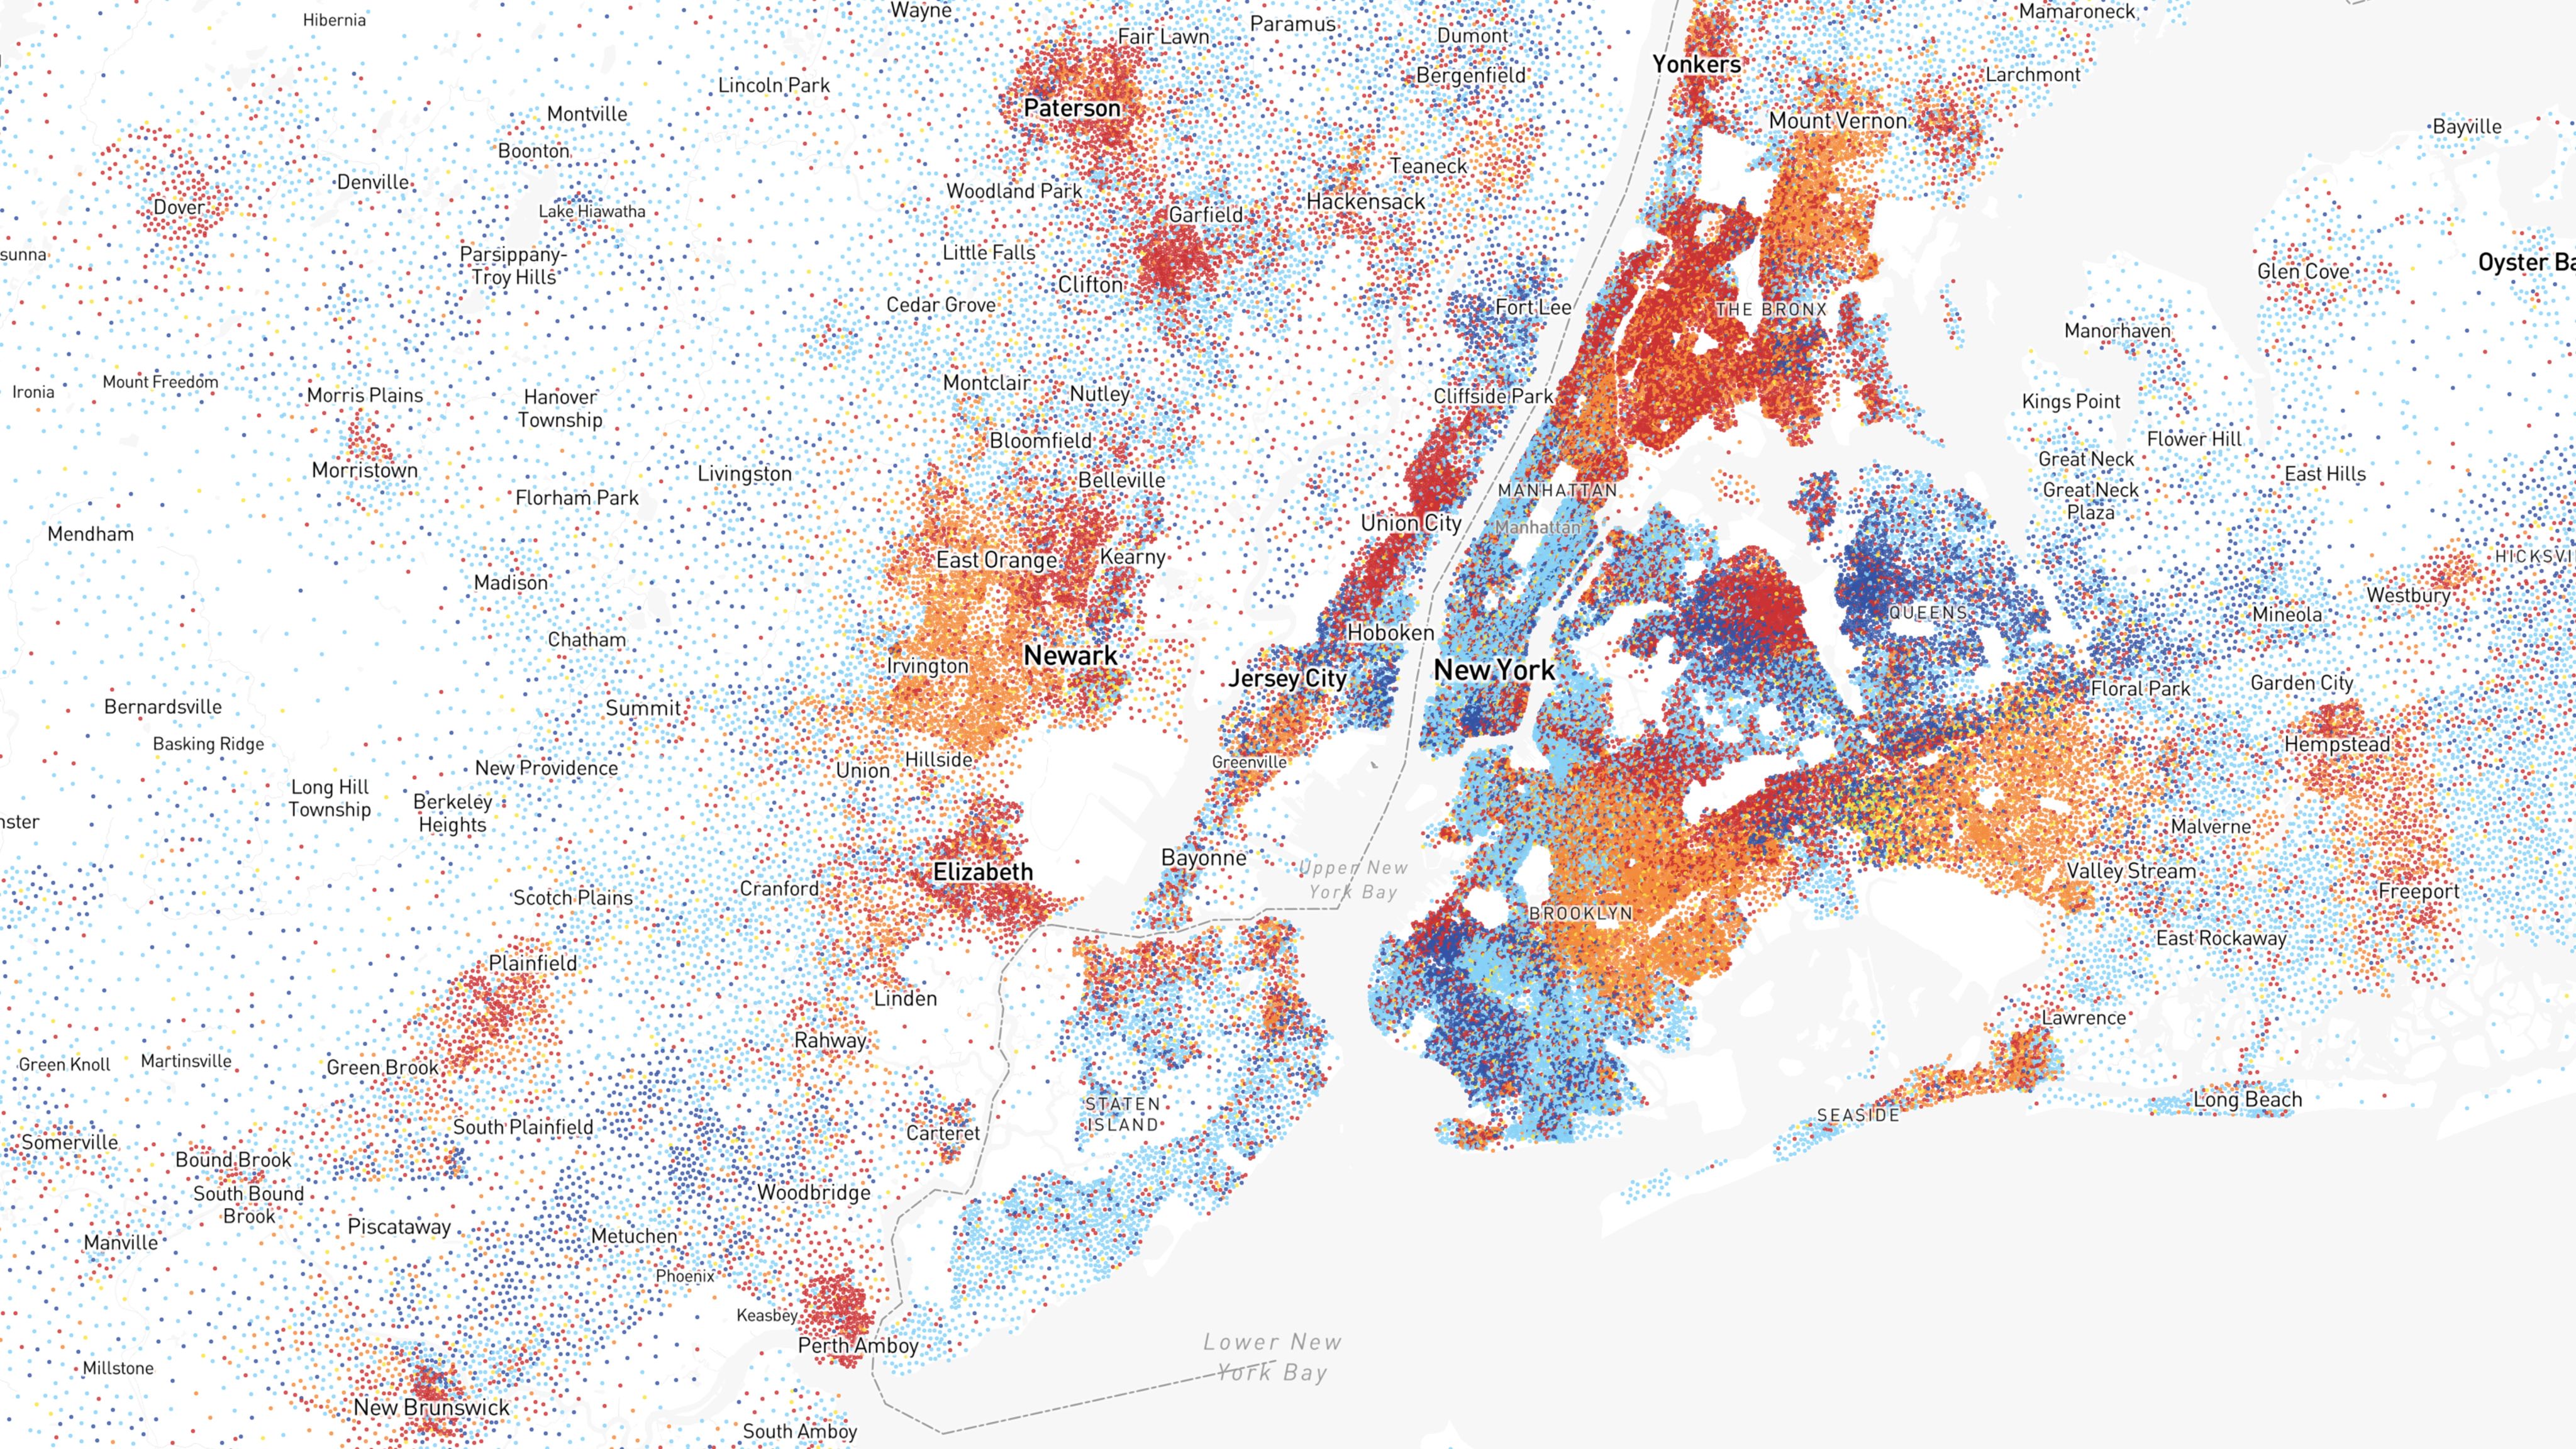
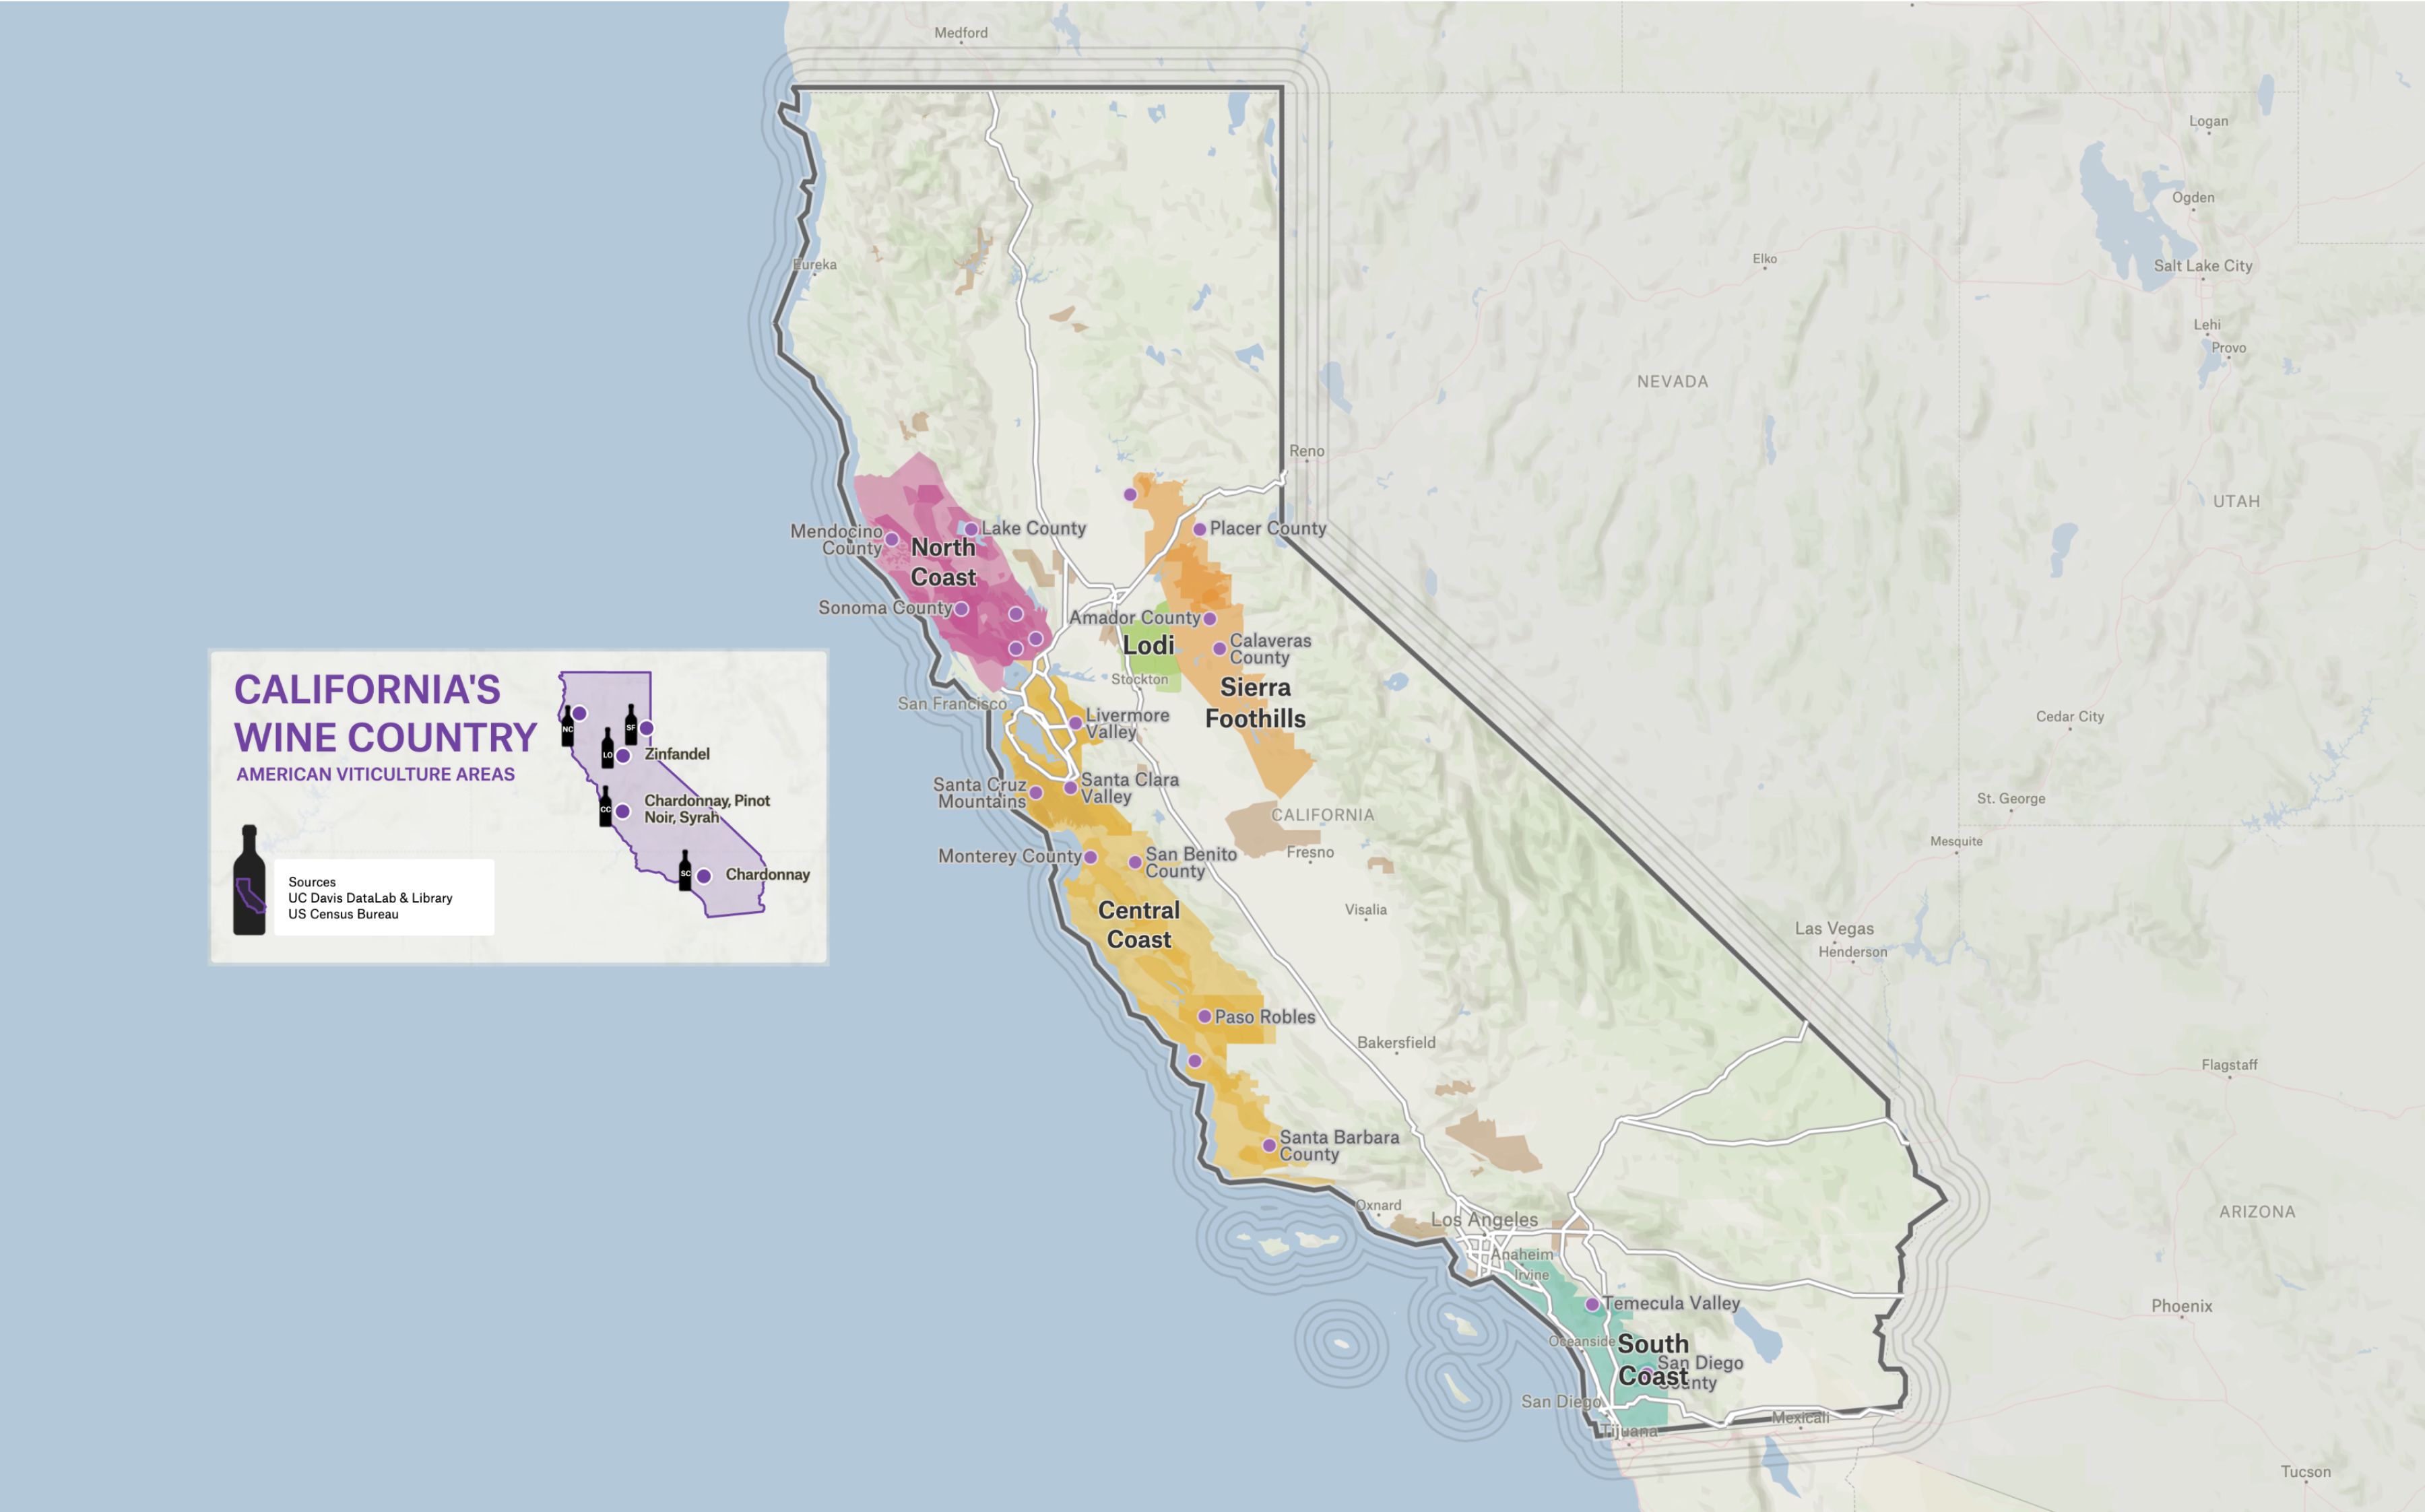
Content creators can use it to build infographics and interactive maps that show population statistics, regional trends and demographic changes. For example, if you’re writing a story about how fast the population of California is growing, you can add in data that shows growth percentages for each county and city. When the reader hovers over the map, it’ll show a detailed breakdown of all the data you’ve inputted.
This map creator also keeps it simple. You can colour-code different parts of your map and customise elements like borders, captions and legends.
Pricing
Your first five maps are free. The standard plan starts at US$12.25/month.

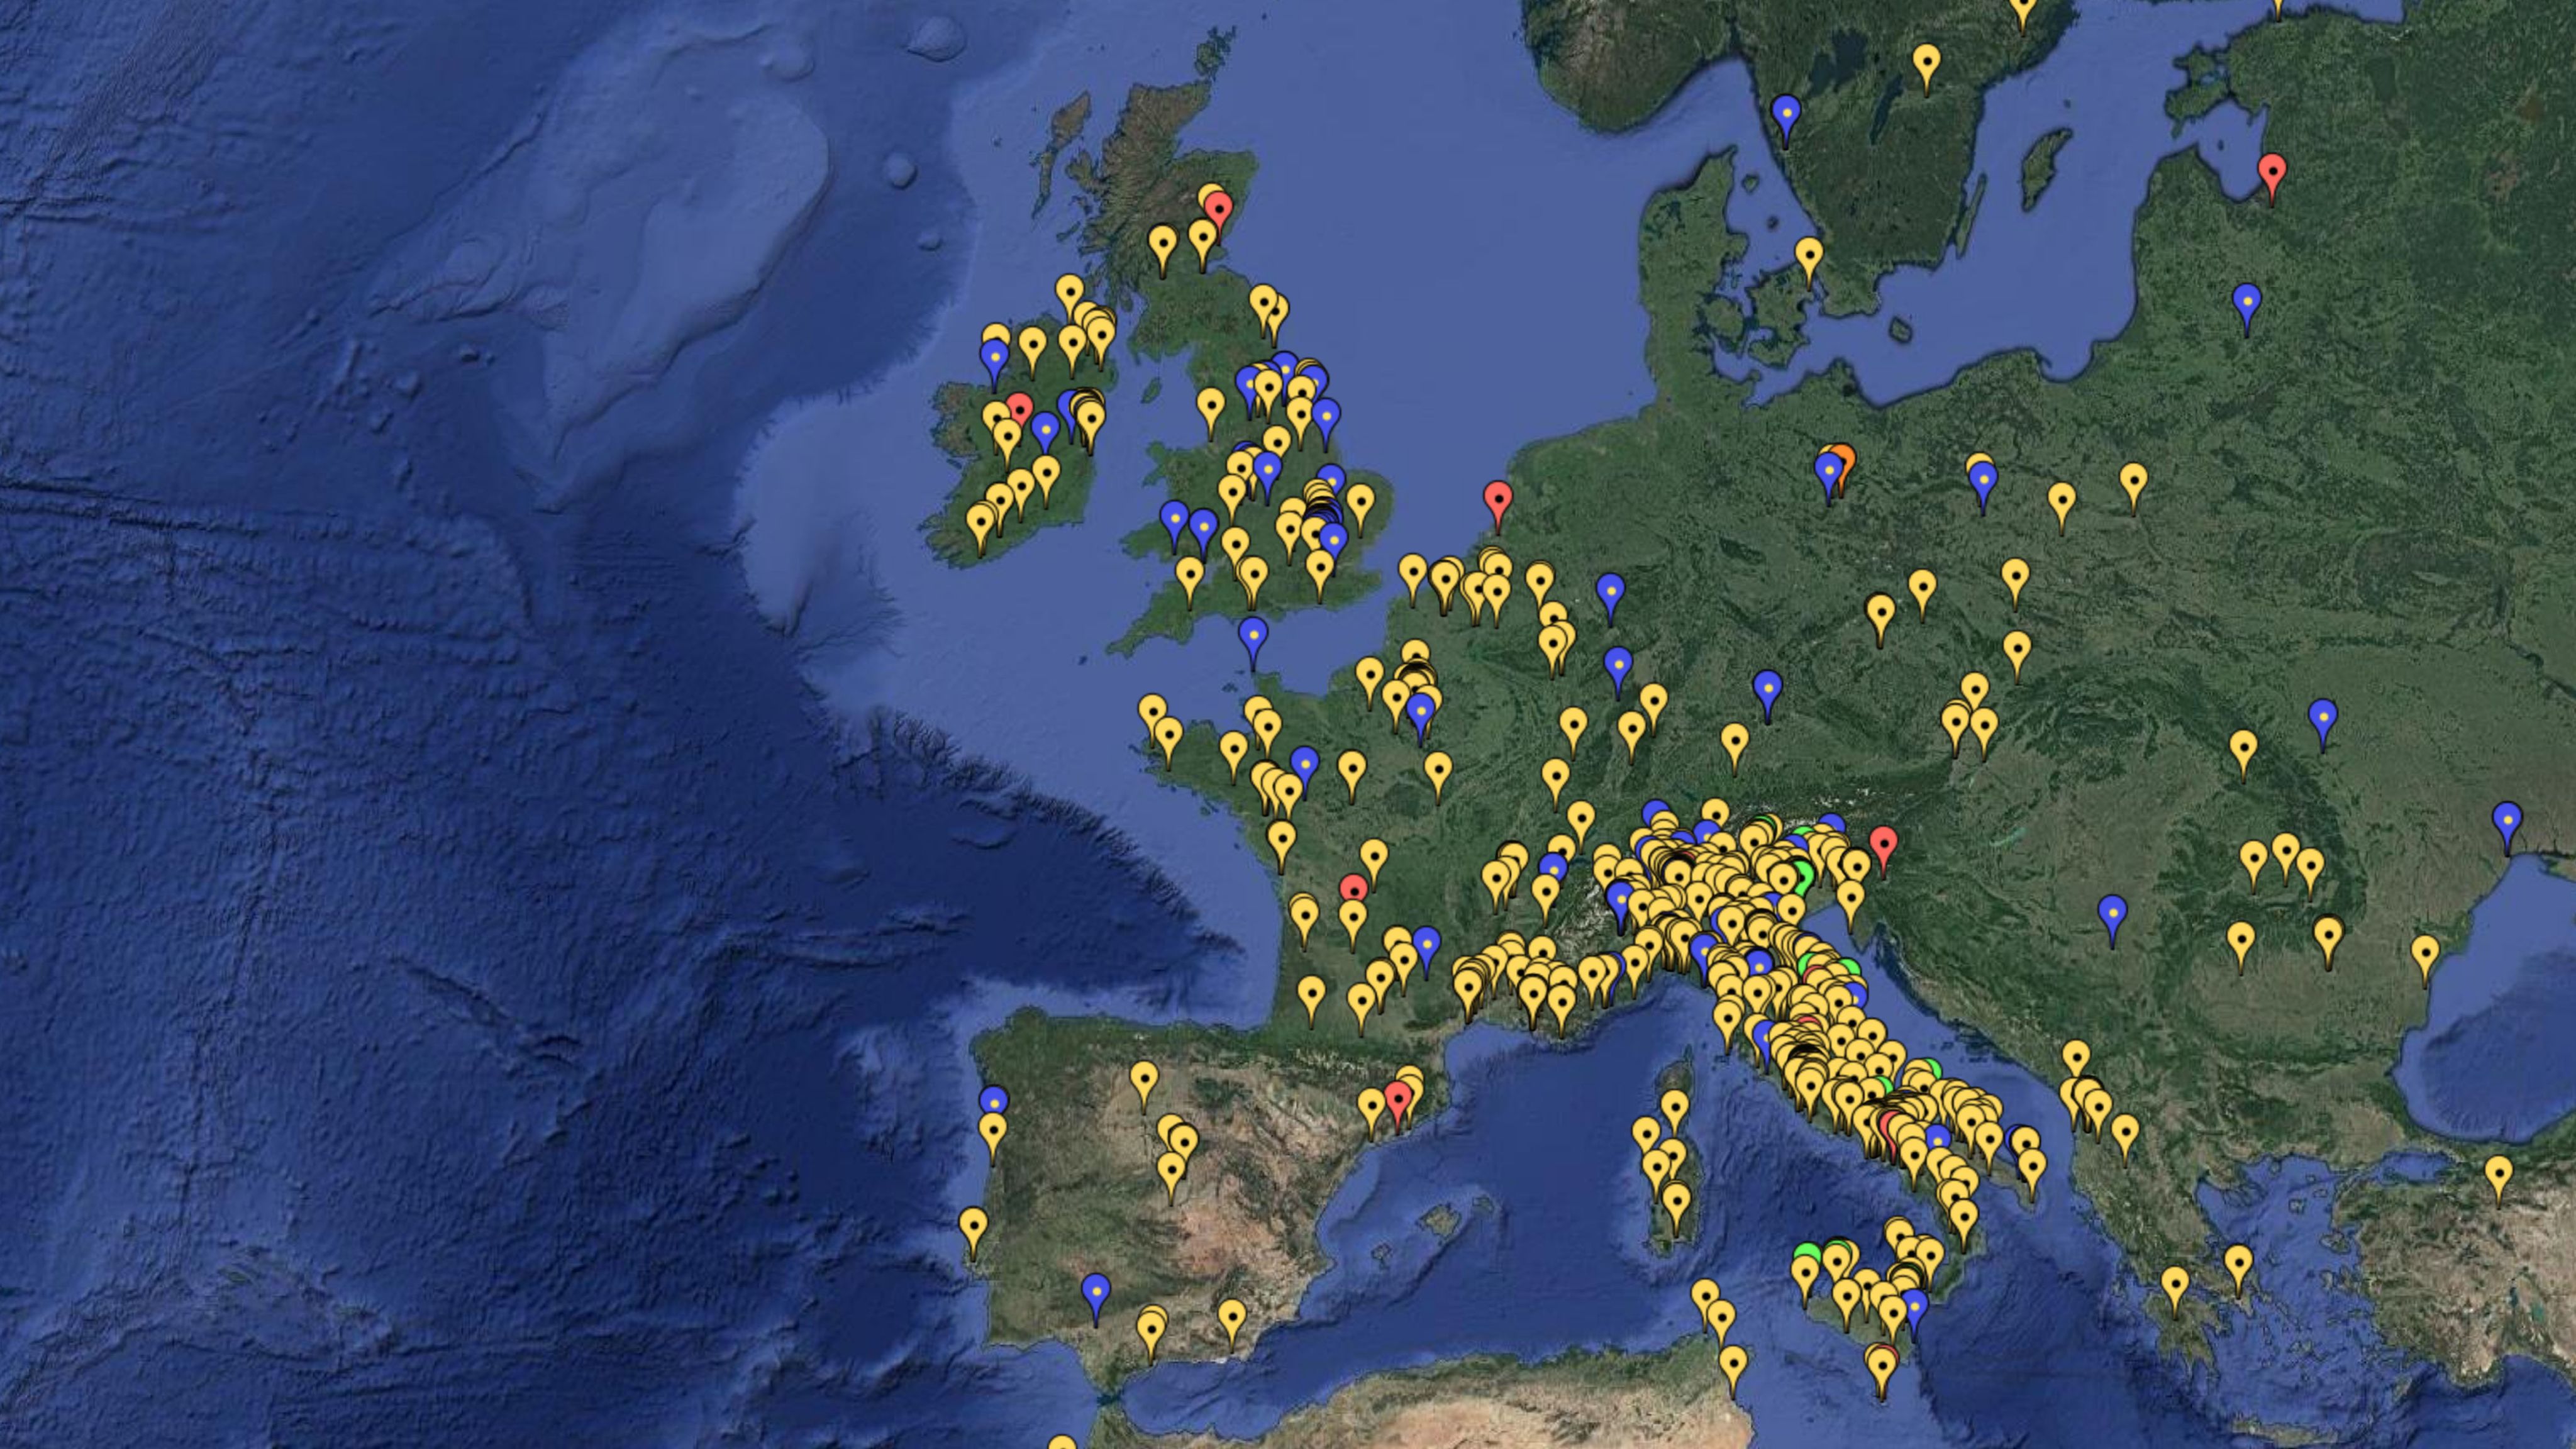

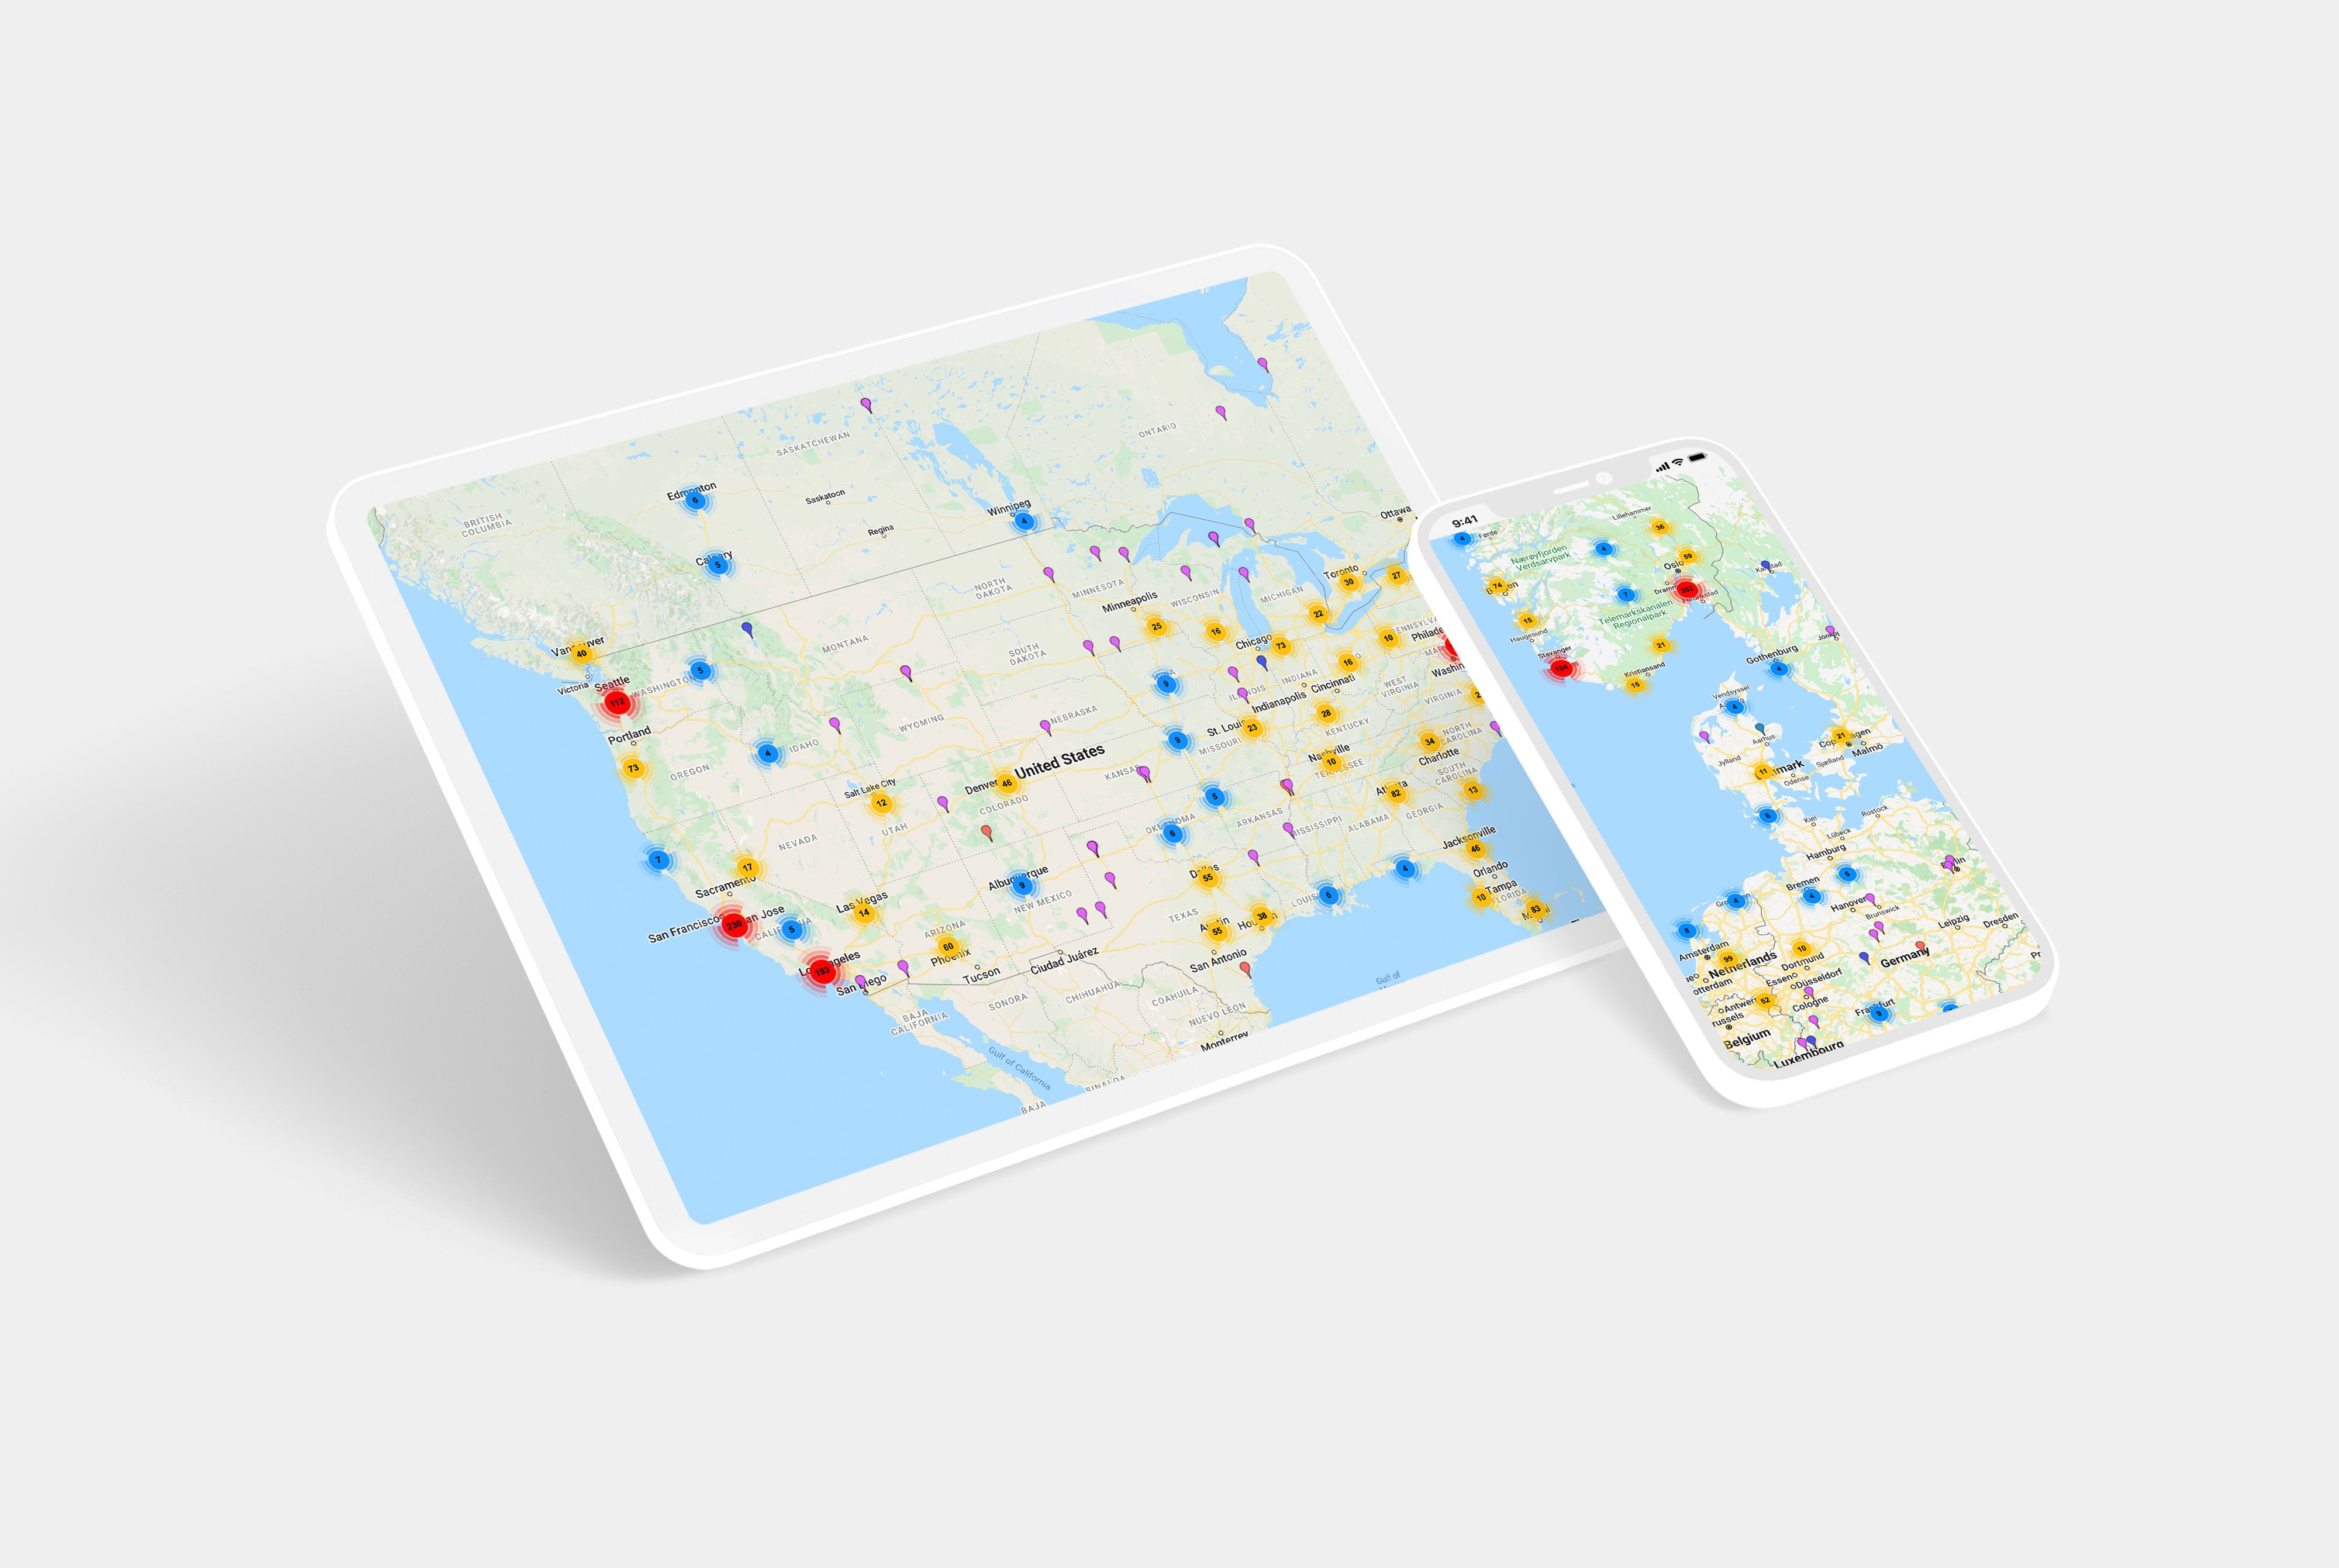
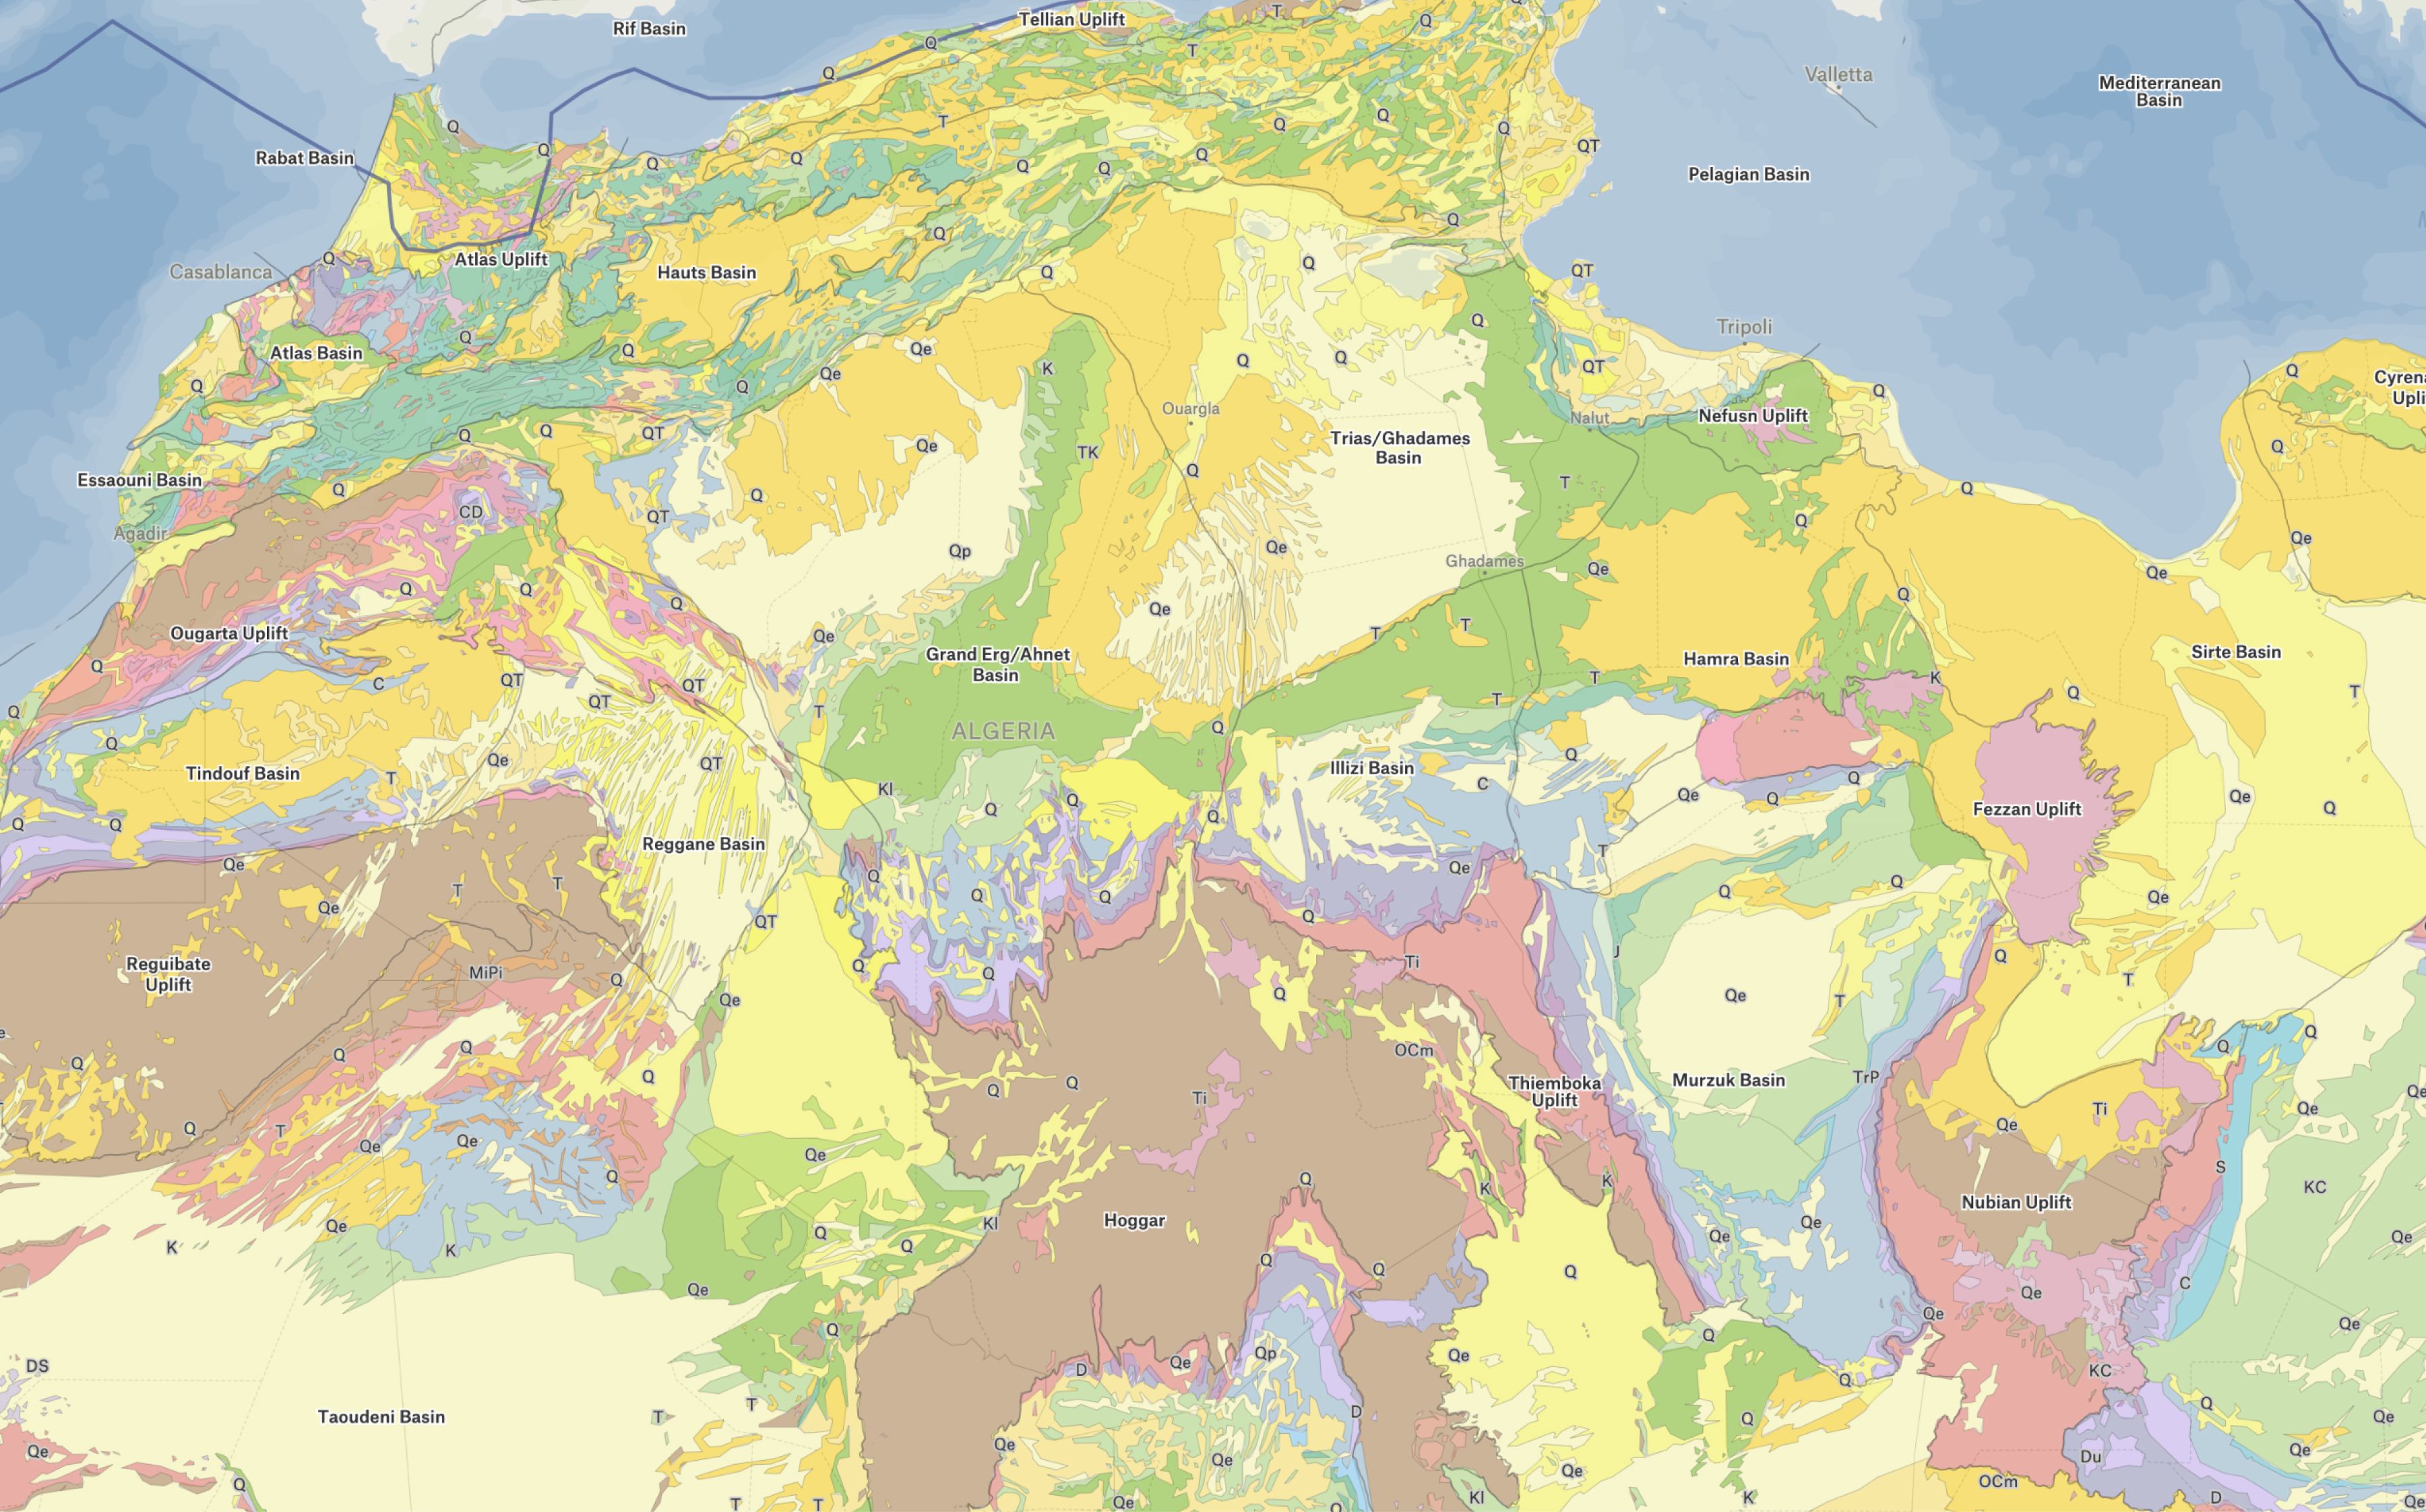
Pull data from several locations, including Crowd Source, Google Spreadsheets, Microsoft Excel, GeoRSS feeds, CSV, and KML files. You can even copy and paste datasets straight into ZeeMaps and then start customising your map's regions, icons and legend.
The maps will work on any smartphone or tablet, so they’re ideal for content creators targeting readers on the move.
Pricing
Free basic plan. The professional plan starts at $19.95/month.
7. Shorthand
With Shorthand, you can create scroll-based map animations from static images. The scrollytelling technology stitches together several static images or illustrations to produce dynamic, interactive maps that come to life as the reader scrolls.
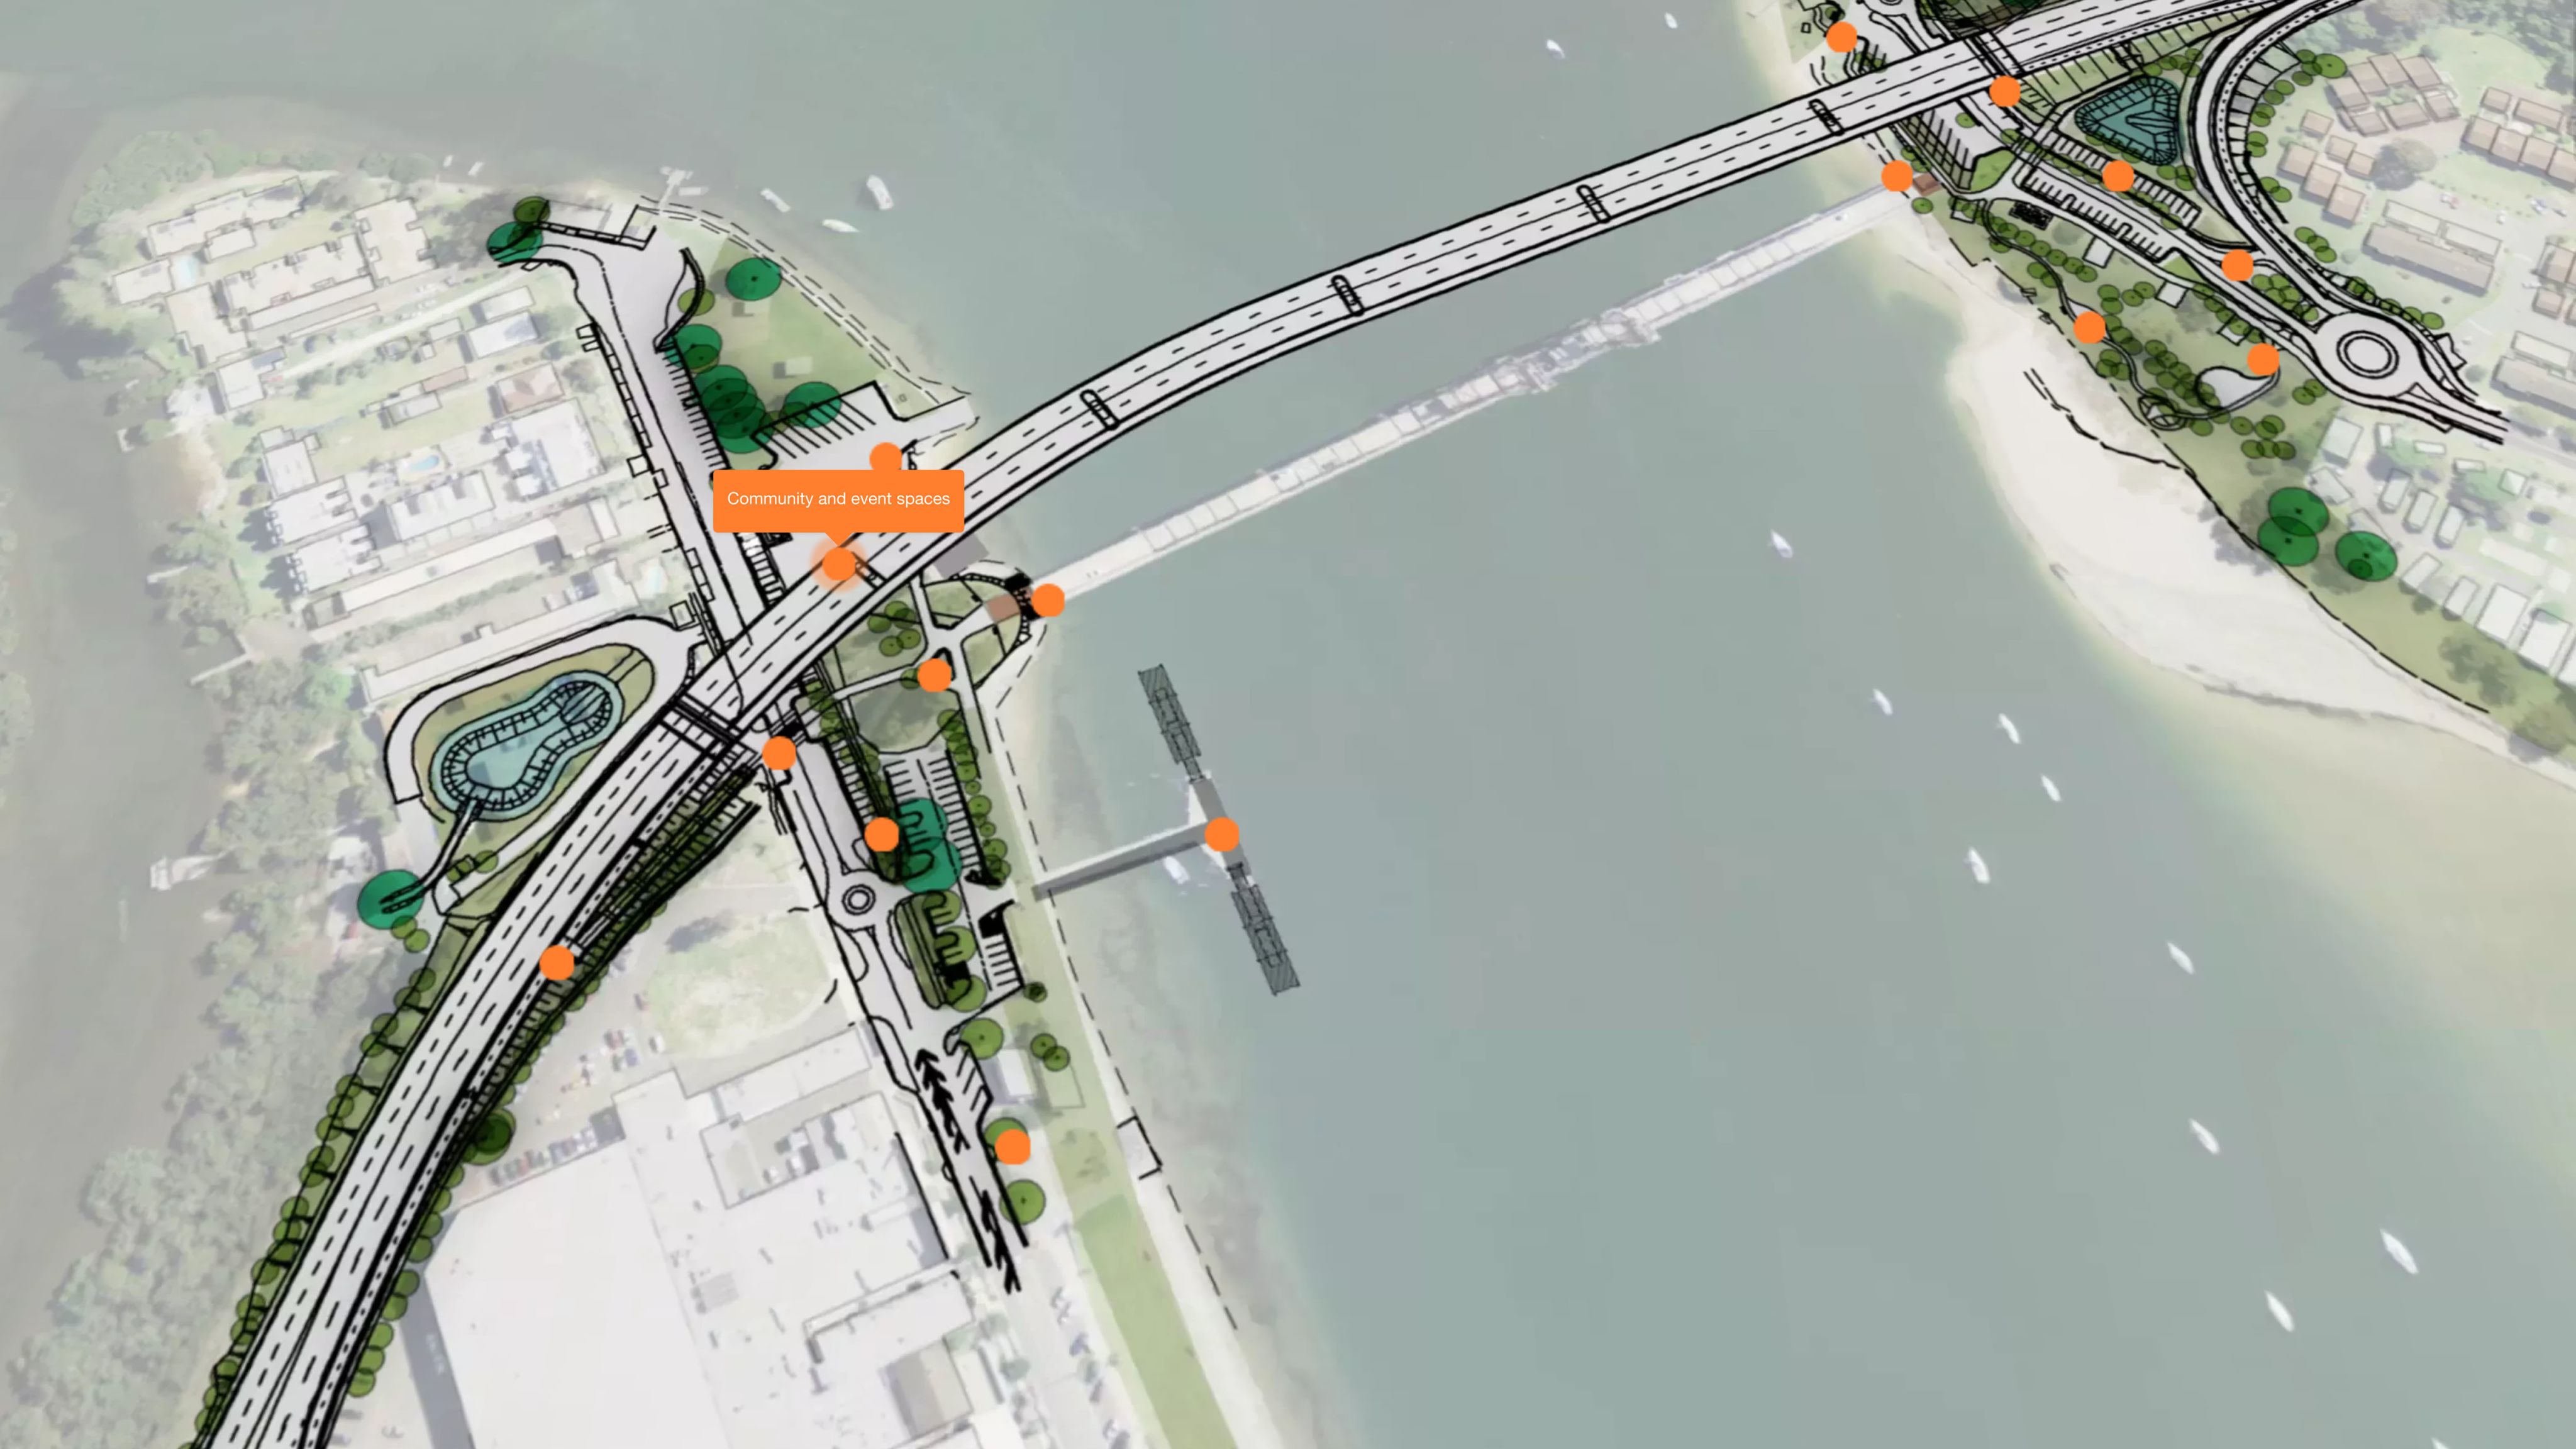
Shorthand also offers Scrollpoints, which allows content teams to take their readers on a journey using a single high resolution image. After uploading your image, simply choose parts of it to highlight, and then optionally annotate the highlights with text.
As the reader scrolls down your Scrollpoints section, your Shorthand story will automatically pan and zoom into each point in turn.
A major benefit of Shorthand is that it is squarely aimed at content professionals, and doesn’t require any developer or GIS expertise to use.
Pricing:
Create your first story for free — no credit card or commitment required. With Starter, Team, Business and Enterprise options, unleash your creativity while only paying for what you need. More details here.


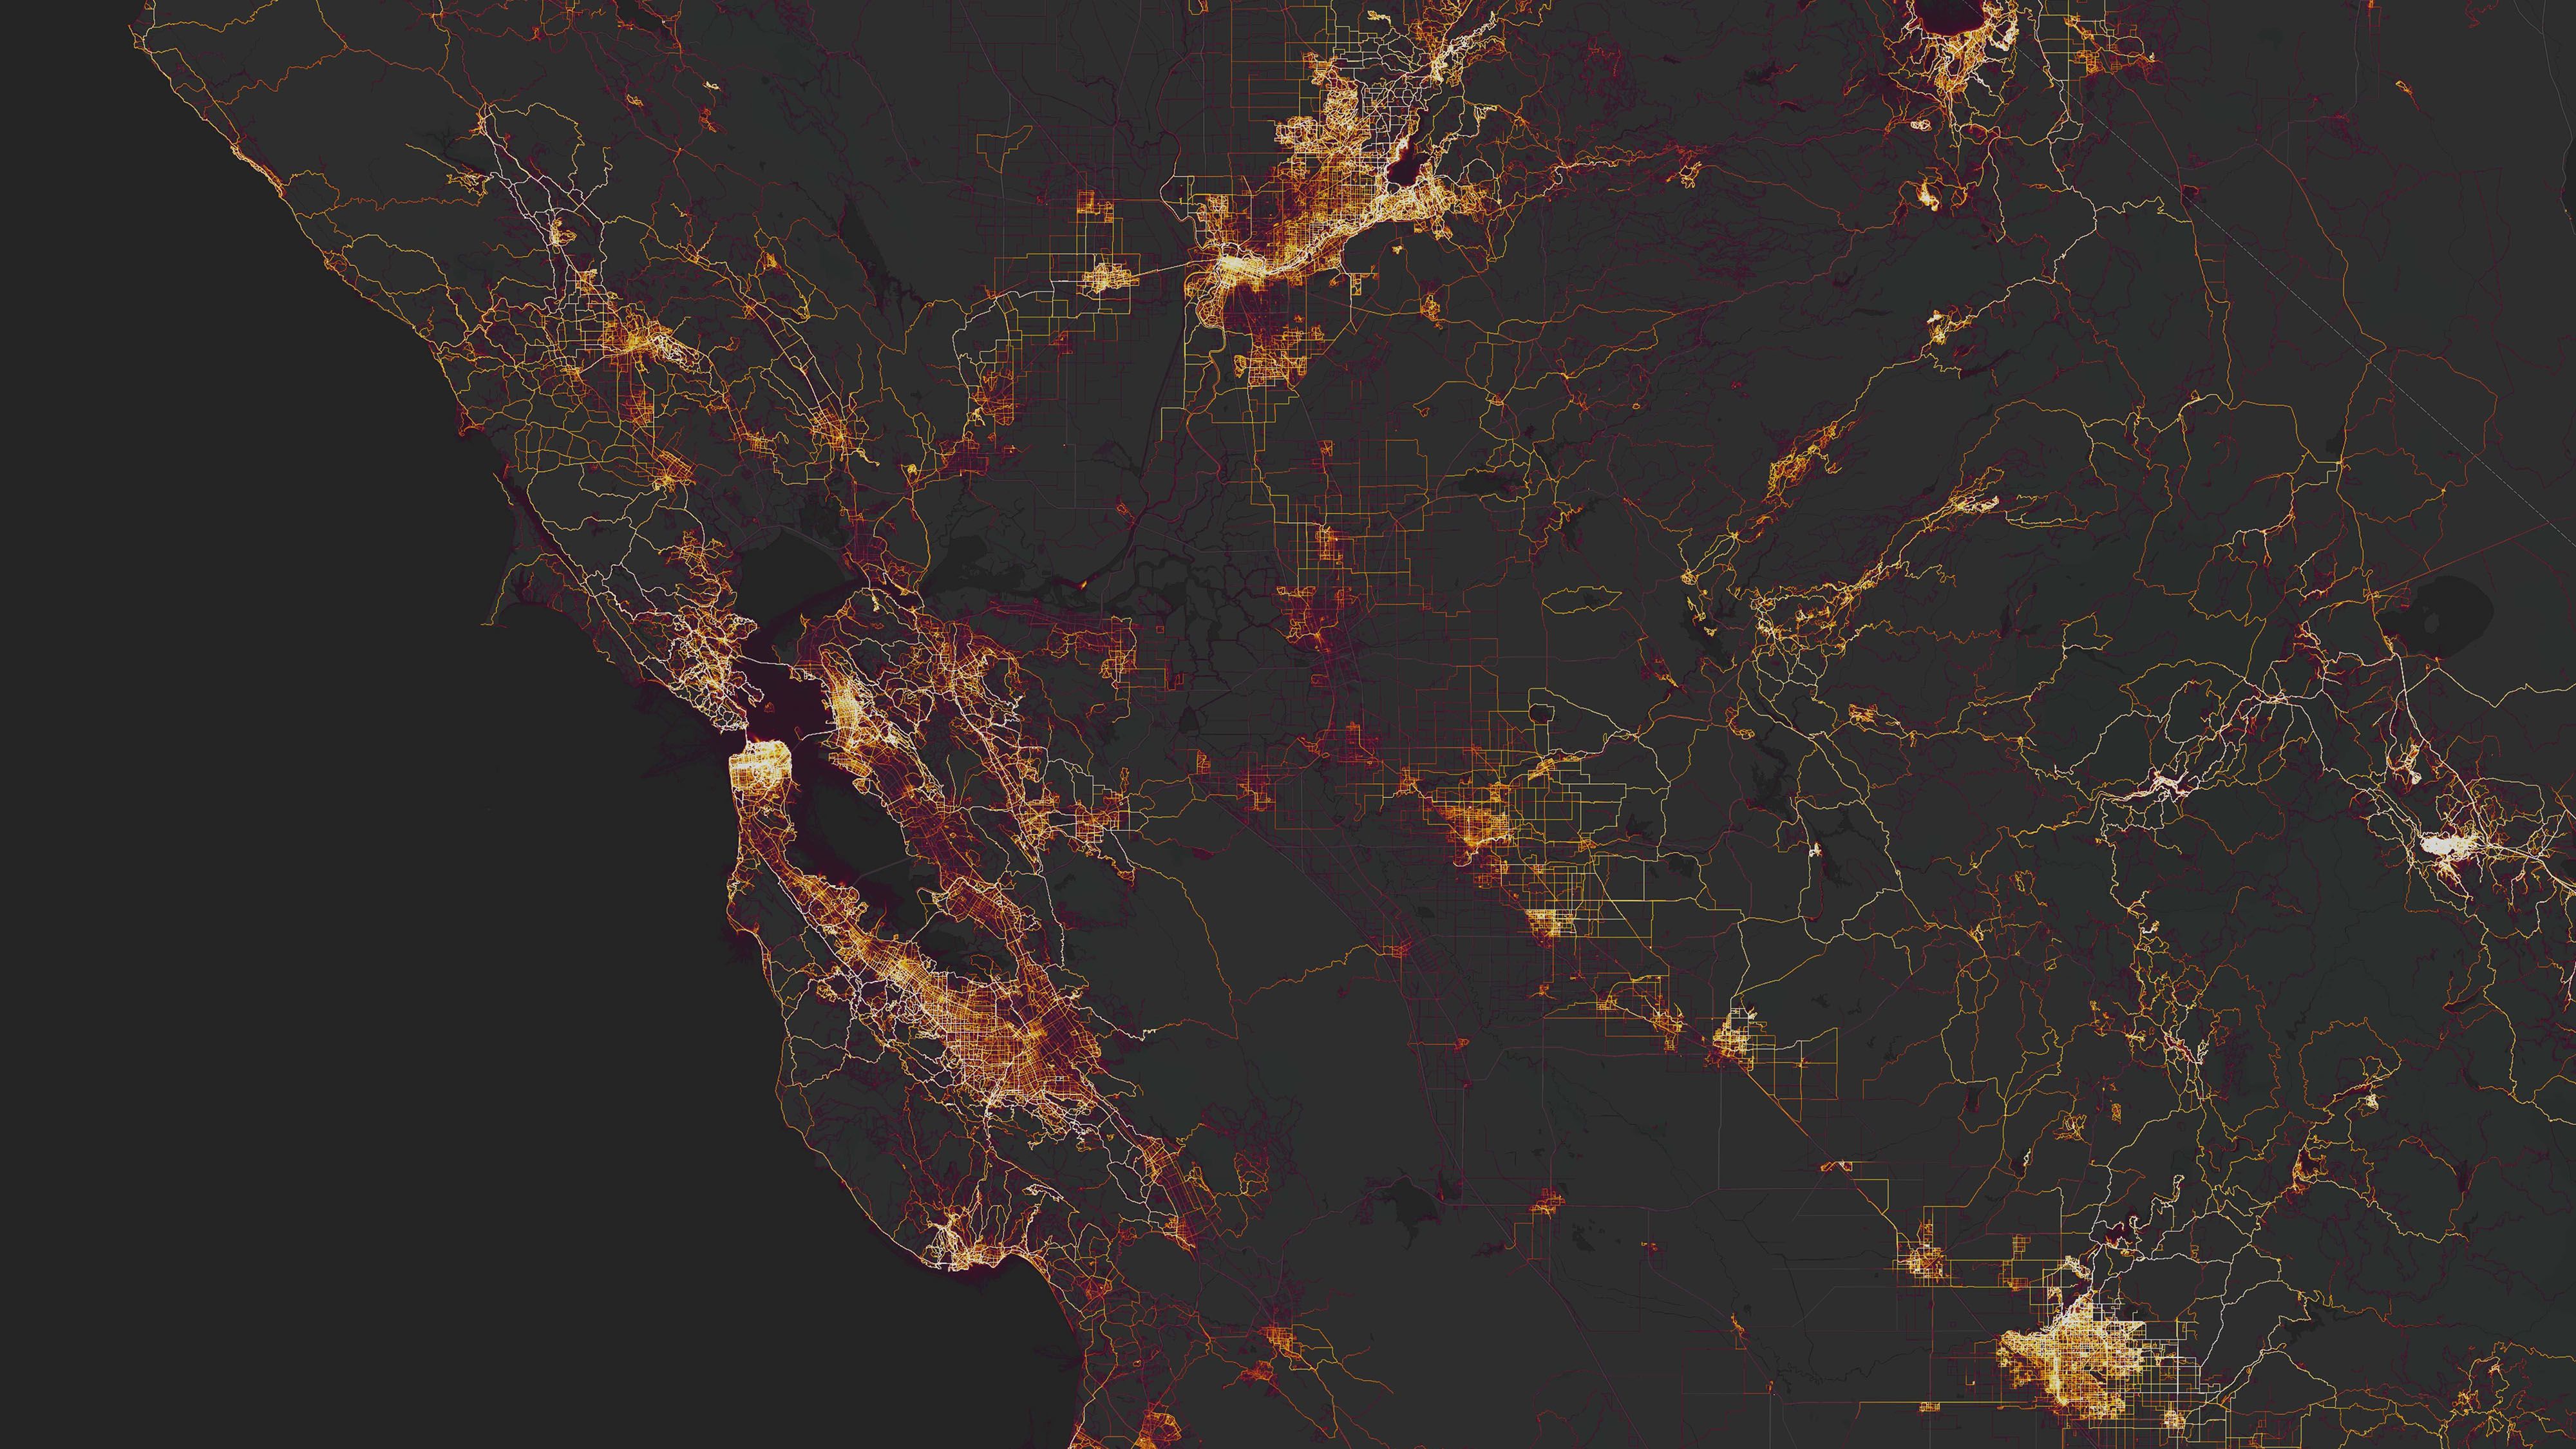
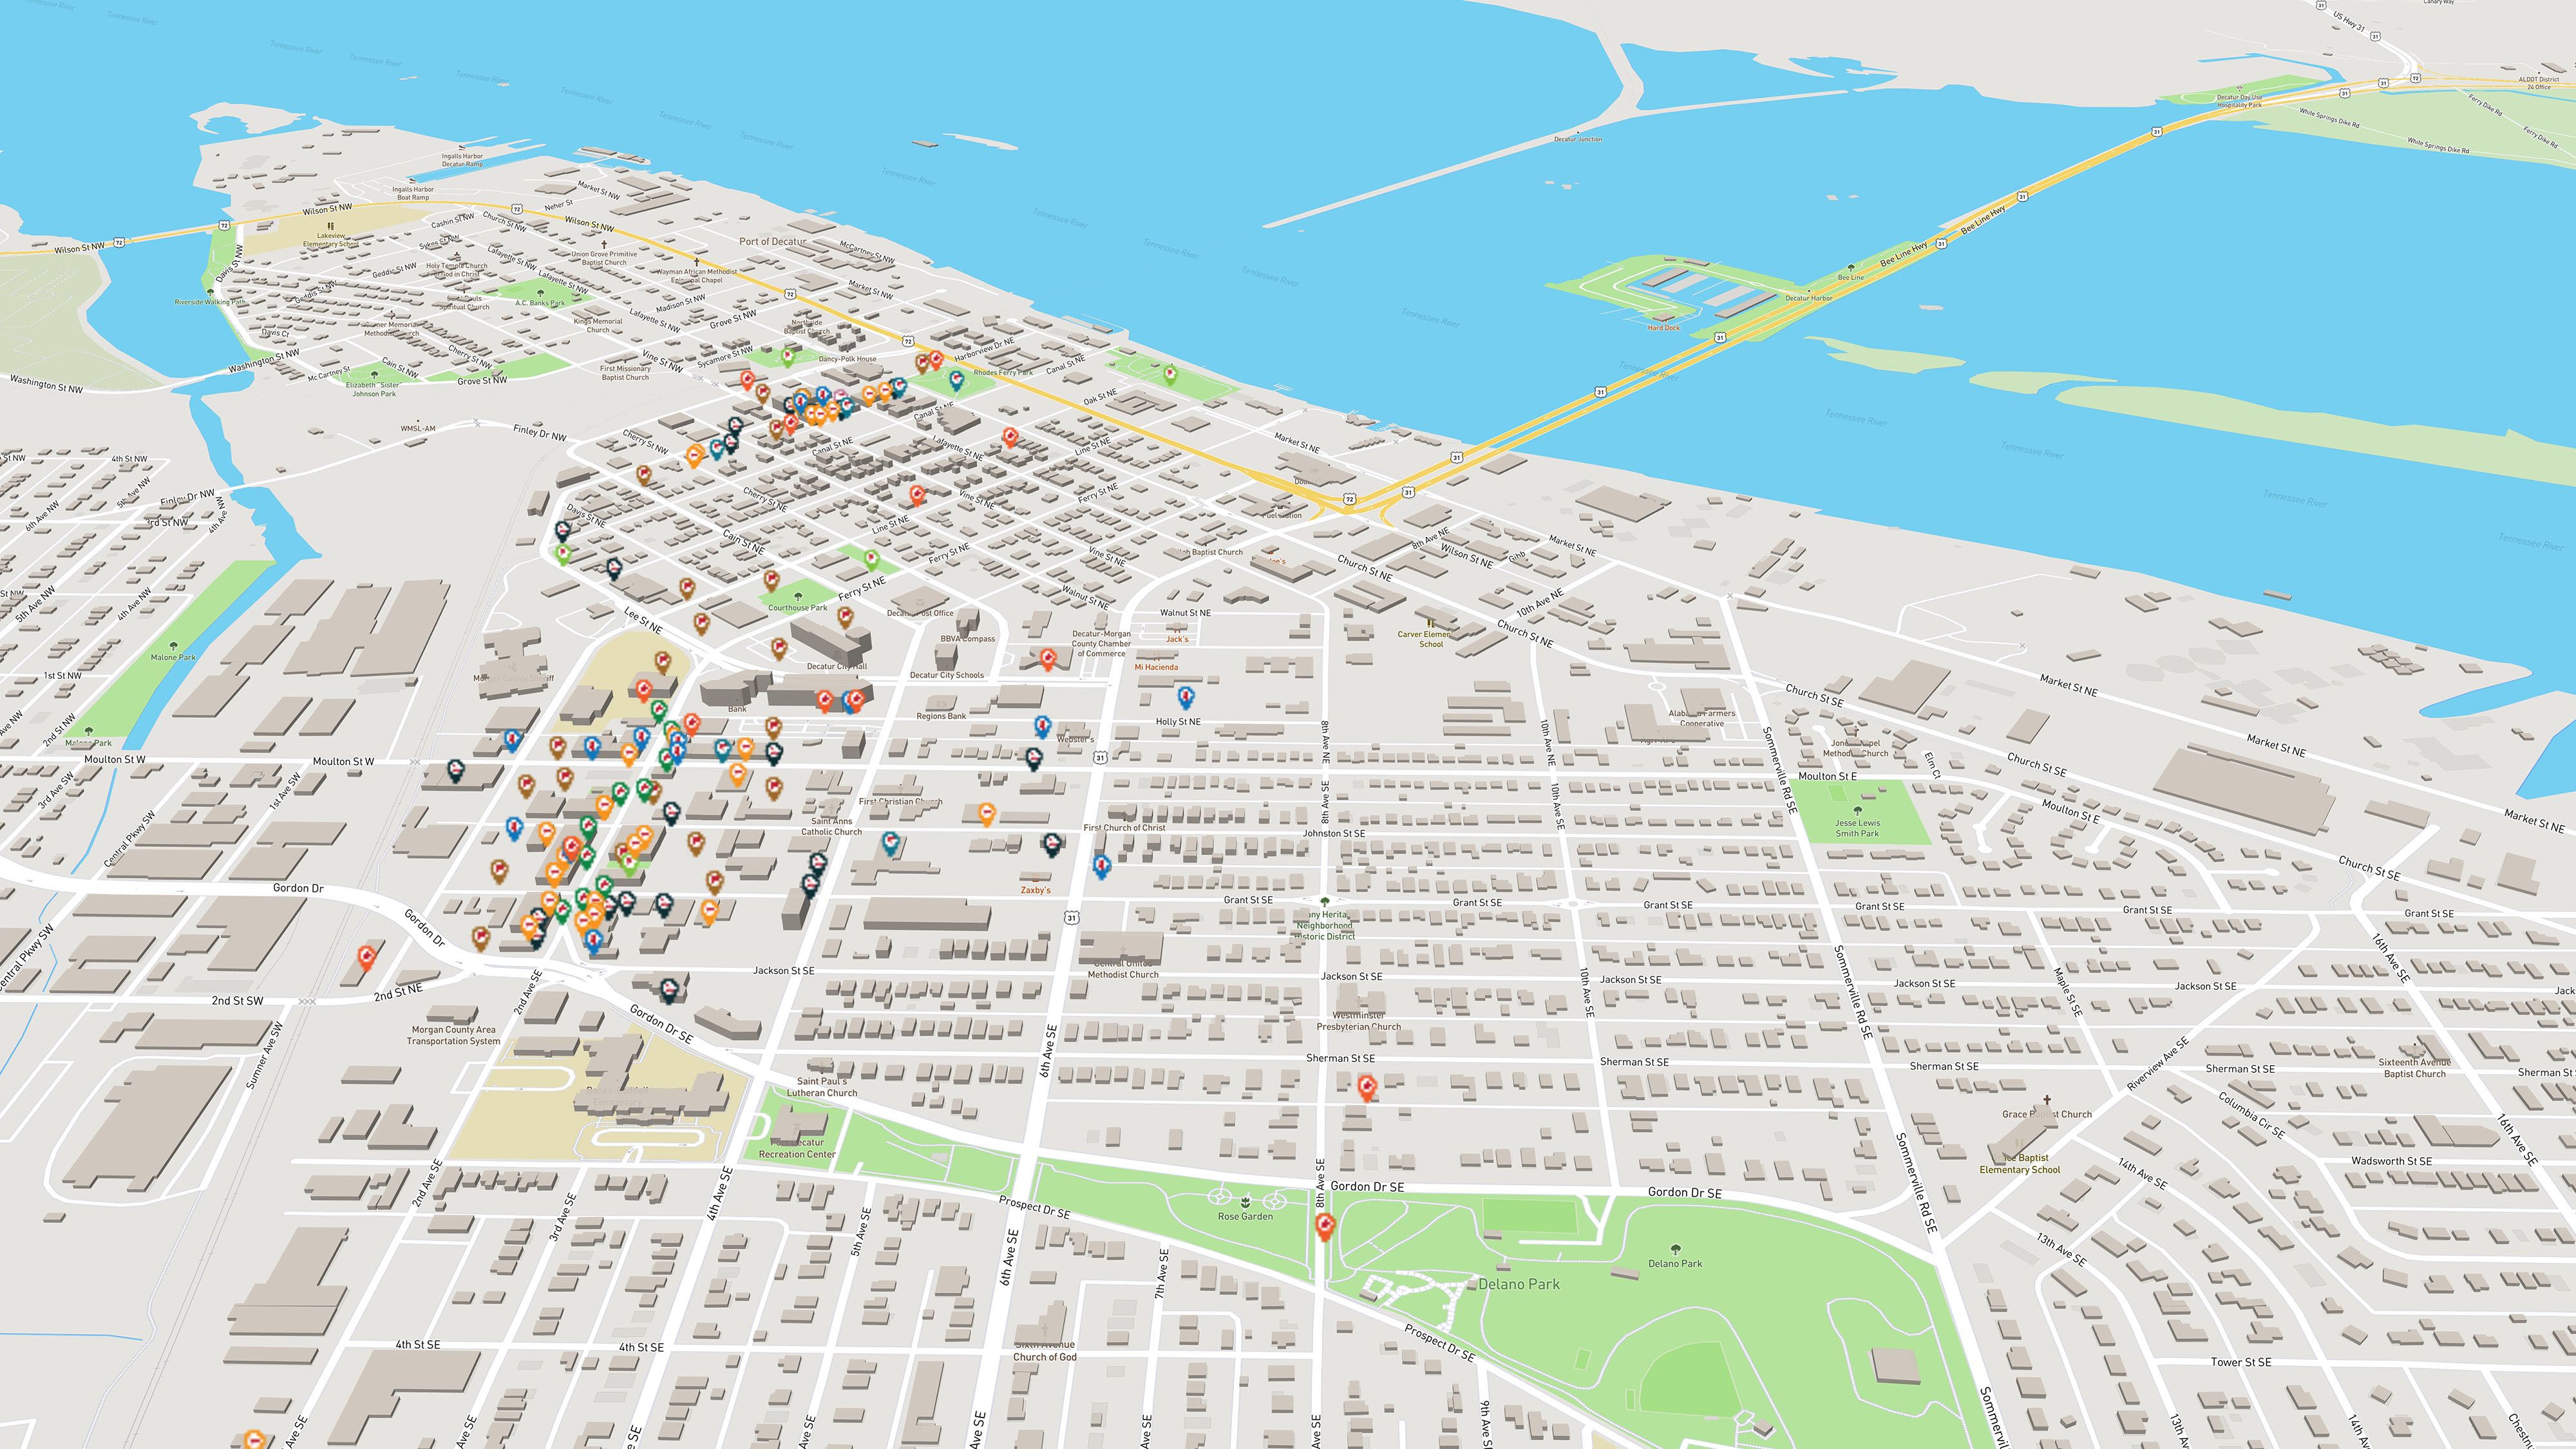
Features like Marker, Highlighter and Notes allow anyone to treat a map like a piece of sketch paper. You can also use their Route and Clip features to draw along roads and boundaries.
You can also add photos, links, and videos directly to the map, in the same way as you would on a blog, website, social media platform... or basically any other content type on the modern web. According to Felt, these features make maps "internet-native" for the first time.
Felt users can also upload their own vector data — supporting all major file formats, up to 5 GB in size.
The tool's basic style editor includes great-looking presets for the most common map visualisations designed by an expert cartography team.
Pricing:
Free for personal use, with paid plans for professionals and teams starting at $200 per month. A free 14-day trial is available.
9. Mapme
Mapme pitches itself as Medium for Maps—a tool you can use to crowdsource data and share stories to create maps without learning to code.


Geared towards realtors, construction companies and non-profits, Mapme allows creators to build layered maps and embed them on most platforms.
It also has a powerful backend and dashboard to track KPIs and see how often readers are interacting with your maps.
Pricing
Starter plans are $30 per month, with free trials available.
10. Scribble Maps
Want to create a high-resolution interactive map? Check out Scribble Maps.
The map builder allows you to design maps from high-resolution images and use data to plot icons or draw custom shapes. Once you're happy with it, you can publish it, embed it in a digital document or even print it as a hard copy.
The big draw with Scribble Maps is its API. It allows tech-savvy content creators to embed interactive maps into their websites to help them tell stories and engage readers.
Pricing
Basic: Free for up to five maps with limited features. Pro: $14-$90/month
Wrapping up

Interactive maps can help bring any piece of content to life.
They are a unique tool to help your audience visualise data and immerse themselves in your story.
It takes the right skill set and toolkit to create this experience. Picking a mapping application that relies on GIS expertise will have a big learning curve unless you hire a developer or learn how to use them. By using a no-code mapping tool, you can create interactive maps and embed them into your website to help tell your story.
The end result is an engaging, interactive map that will capture and keep your reader's attention.
More to explore
Kimberlee Meier is a B2B/SaaS Content Writer who also helps start-ups fuel their growth through quality, evergreen content.