How to create interactive graphics
Animate graphics and charts for the web — no coding required.


How to create interactive graphics
Animate graphics and charts for the web — no coding required.
At Shorthand, we're passionate about making sure all our users know how to get the very best results with our tool.
by Dawn Murden
Interactive graphics are visuals that respond to user actions — like scrolling, clicking, or hovering — to reveal material progressively. In this guide, you’ll learn how to create interactive graphics using scroll-driven animation in Shorthand, with examples and best practices — no coding required.
We'll cover:
What are interactive graphics?
Interactive graphics may include:
- Scroll-driven storytelling elements like scrollmation, video, interactive maps, or scrolling timelines.
- Click- or hover-driven elements like carousels, buttons, click and drags, or sliding scales.
- Interactive infographics such as scrolling charts, graphs, and data visualisations.
This article focuses mainly on Scrollmation — scroll-driven interactive graphics and media.
Why are interactive graphics effective?
- Increased engagement.
Research confirms that stories using interactive storytelling elements have a positive effect on page dwell time and article scroll depth. - Improved comprehension and recall.
Revealing complex details step-by-step instead of all at once helps your audience absorb the material at their own pace. - Better narratives.
Interactive graphics give the storyteller control over pace and focus, building a reading experience that encourages scrolling. To see some of the best scroll-driven narratives on the web, check out our examples of engaging scrollytelling. - They encourage exploration.
Interactive graphics give the reader power over what to engage with, aiding UX and encouraging longer time on site. - They make data feel tangible.
Complex data can bore readers and drive them away from your site quickly. Interactive graphics are a sure method to cleverly package complex data in simple, visual ways.
When not to use interactive graphics
- if the message is simple enough for a static graphic
- if mobile constraints or performance would harm UX
- if interaction adds 'friction' rather than clarity.


How to create your interactive graphic with Shorthand


1. Choose your tool and interaction type (scroll-driven, hover, animated chart). Consider your audience, how they like to engage with content, and which device they’re most likely to use.

2. Storyboard the frames. Draft what viewers will experience as they move from one ‘step’ to the next.

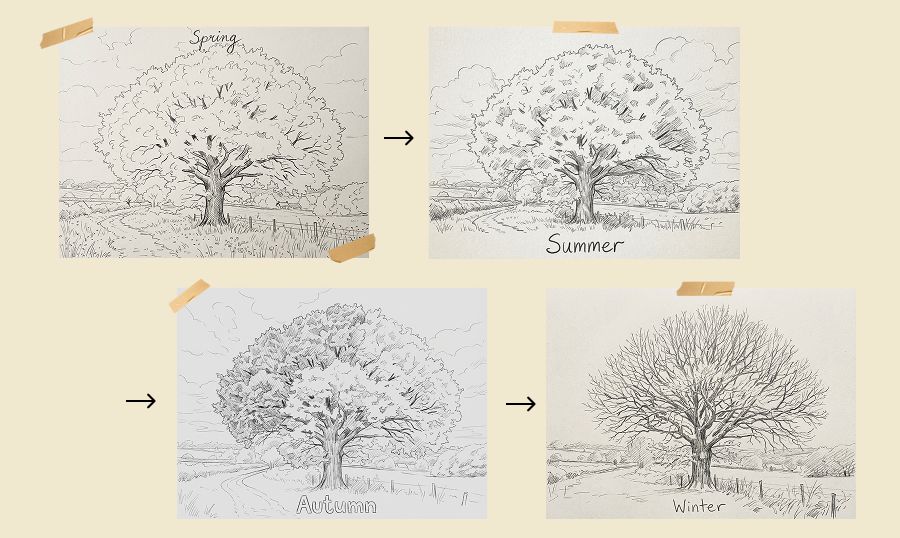
3. Create and prepare your assets.
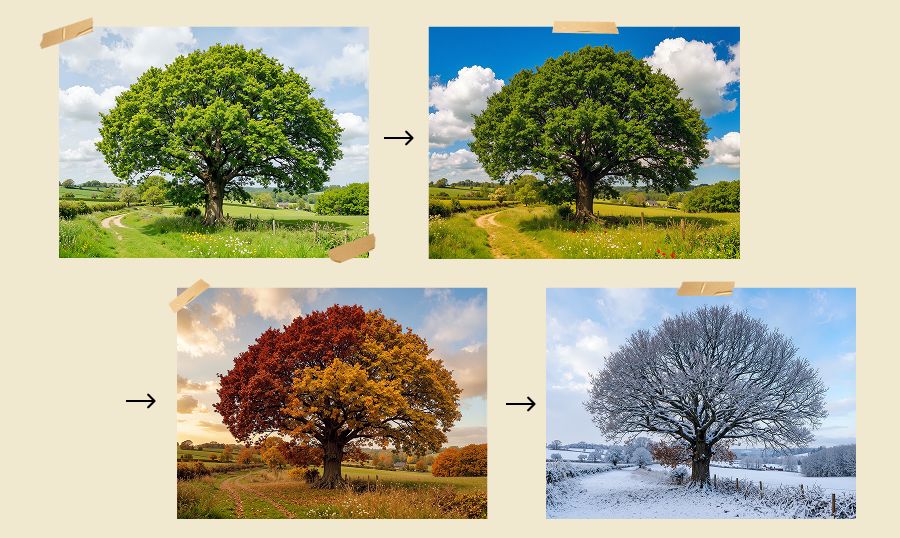
4. Build it.


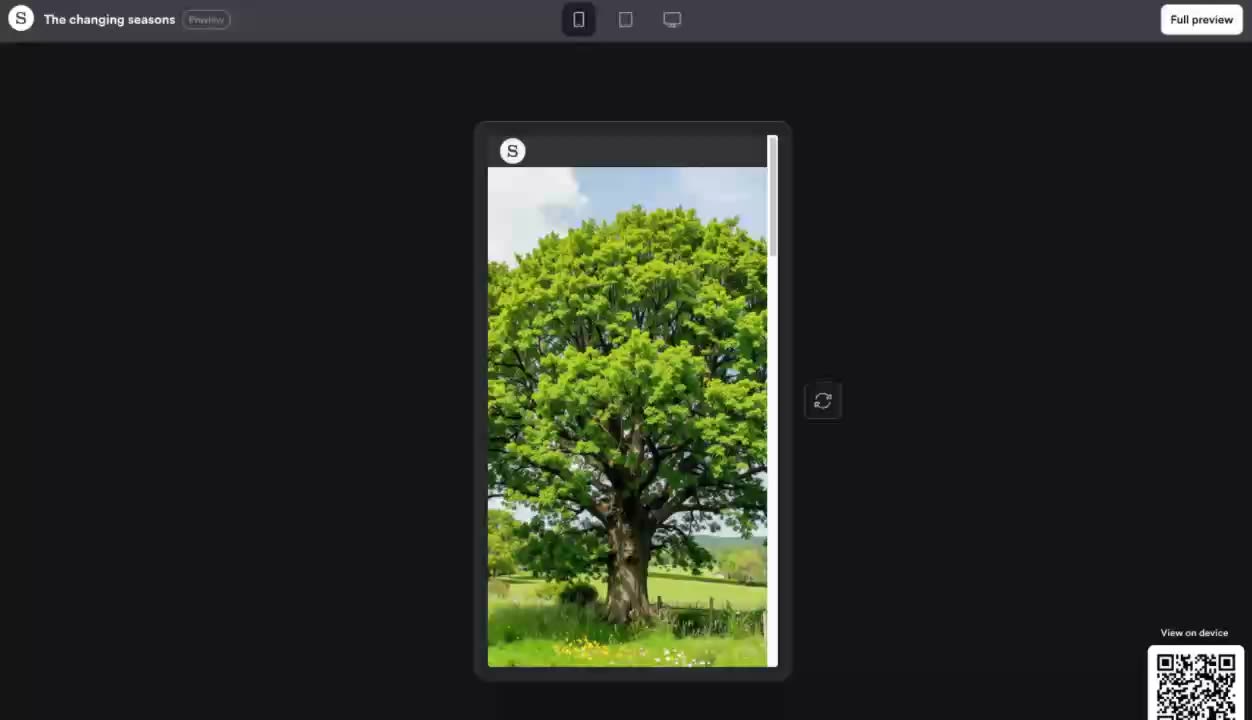
5. Check it. Preview often as you work — on both mobile and desktop.
6. Run performance checks. Interactive graphics can increase file sizes, so check load speed, image weight, and accessibility to make sure you’re not hurting the story’s user experience.


7. Publish and measure: What was your goal for including an interactive graphic? Did it improve performance in the way you intended?


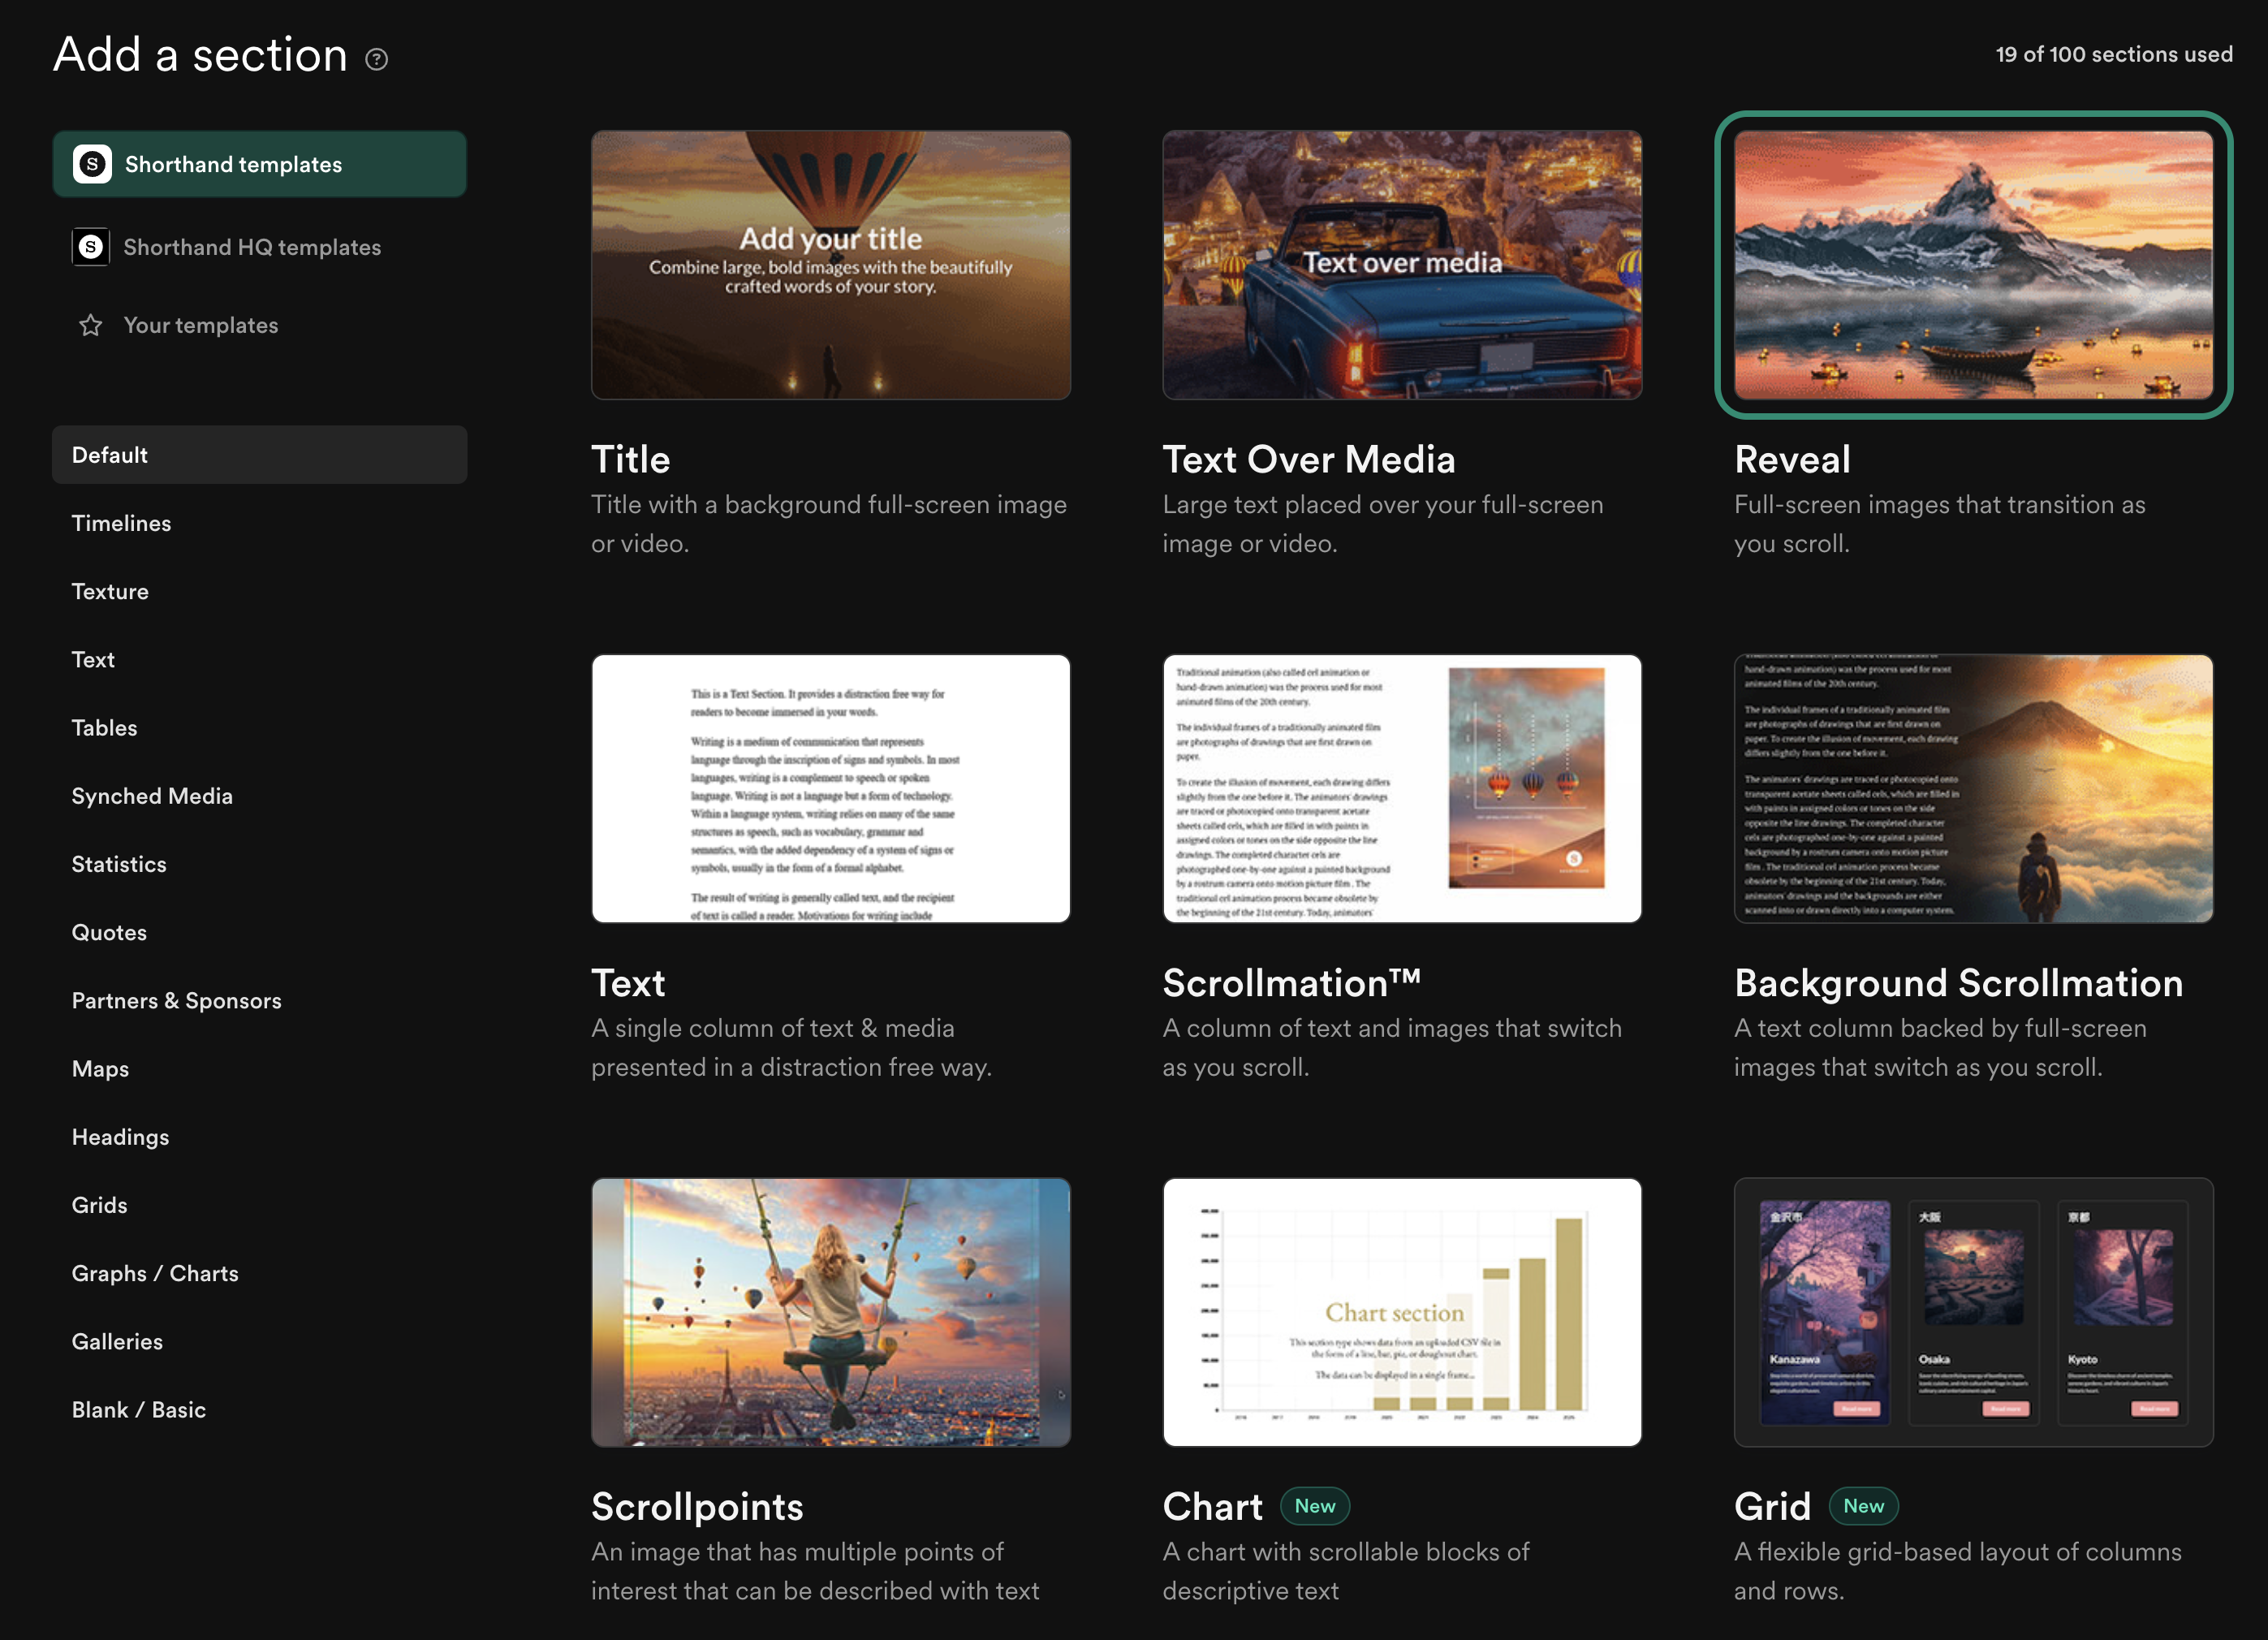
Interactive graphic tools — and examples of them in use
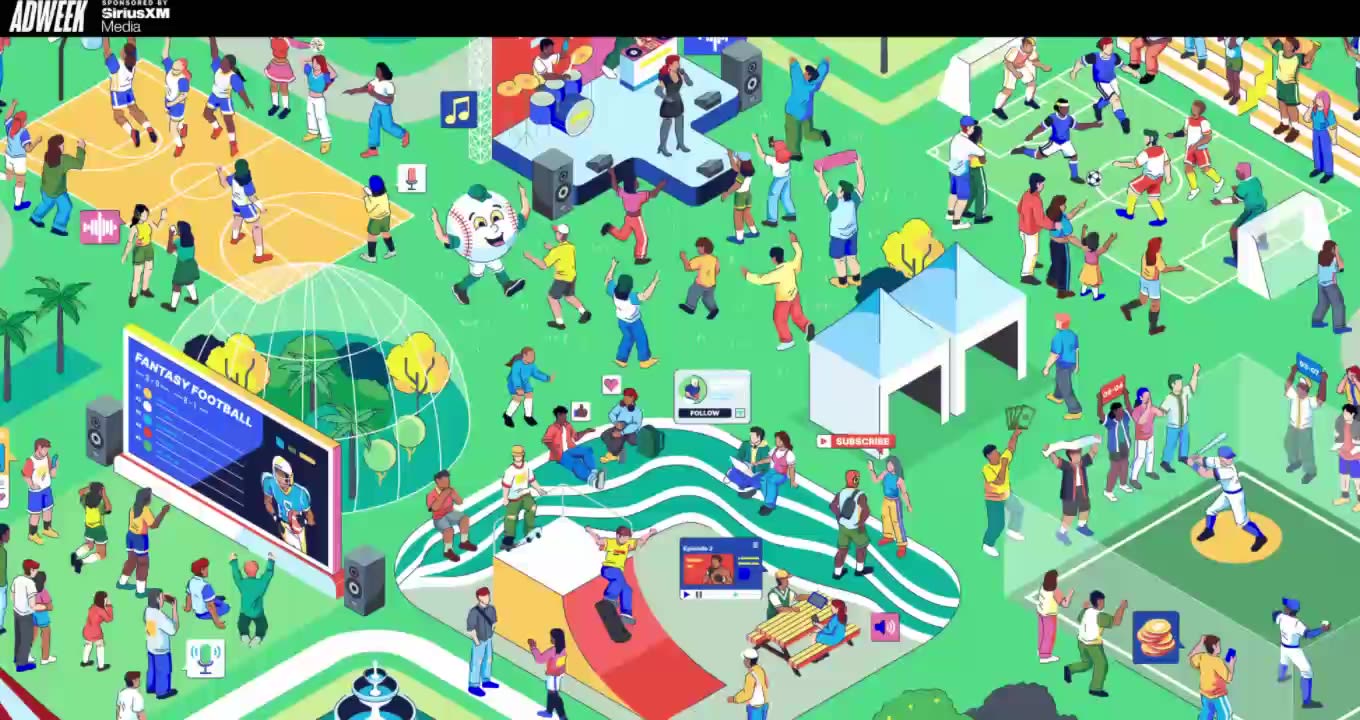
Scrollpoints
If you have an image you want readers to scroll around to discover different pieces of information — like a map, a painting, or a group photo — Scrollpoints is the perfect tool.
In ‘Turning up the volume on sports fandom’, a sponsored piece in Adweek, readers scroll around a large illustrated image featuring different sporting fan groups. The experience pauses at various ‘scrollpoints’ to reveal short snippets of text about each group.
We loved this story so much, we named it in our 16 Best Shorthand Stories of 2025.
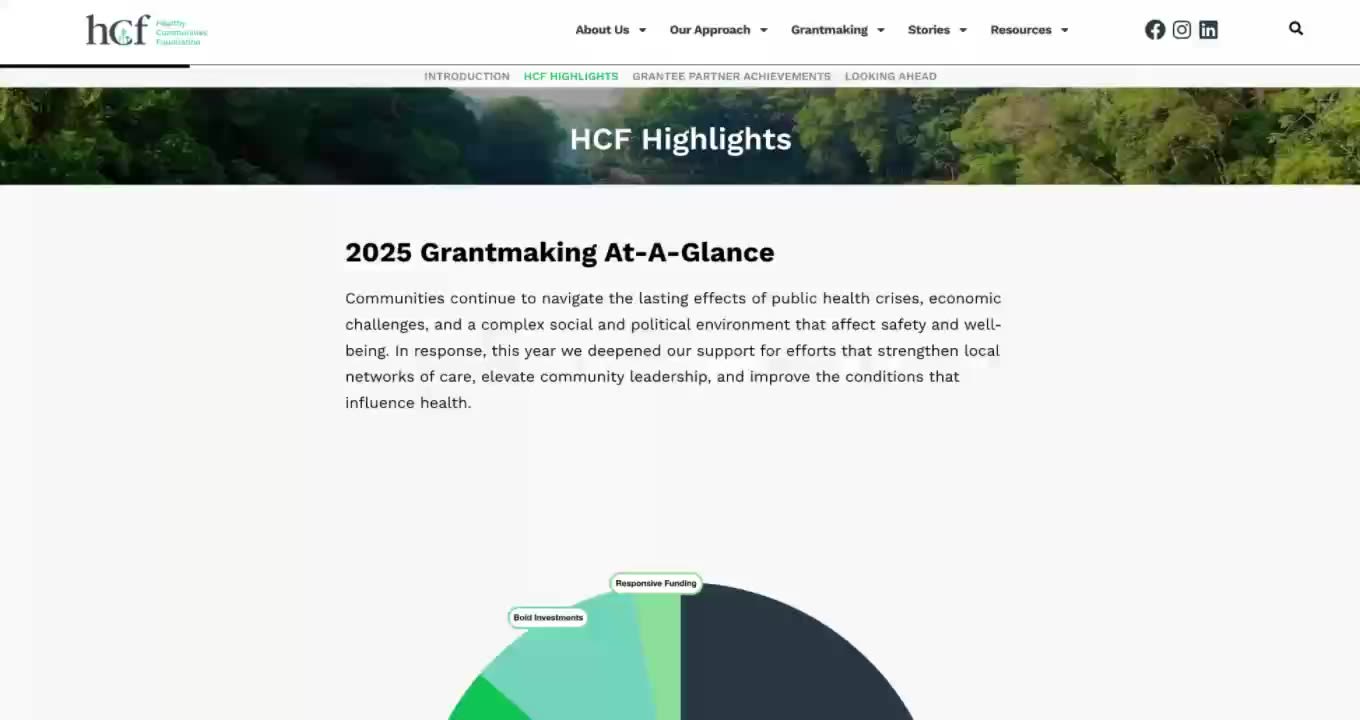
Chart
Figures in a large grid can feel static — and can have readers clicking away quickly. Interactive graphics built in the Chart tool are an effective way to communicate complex data in a clear, engaging way.
Take this 2025 report by the Healthy Communities Foundation. A pie chart — already a familiar data-visualisation format — is animated to highlight different datasets as the reader scrolls. In this case, it spotlights areas of community grants and investment.
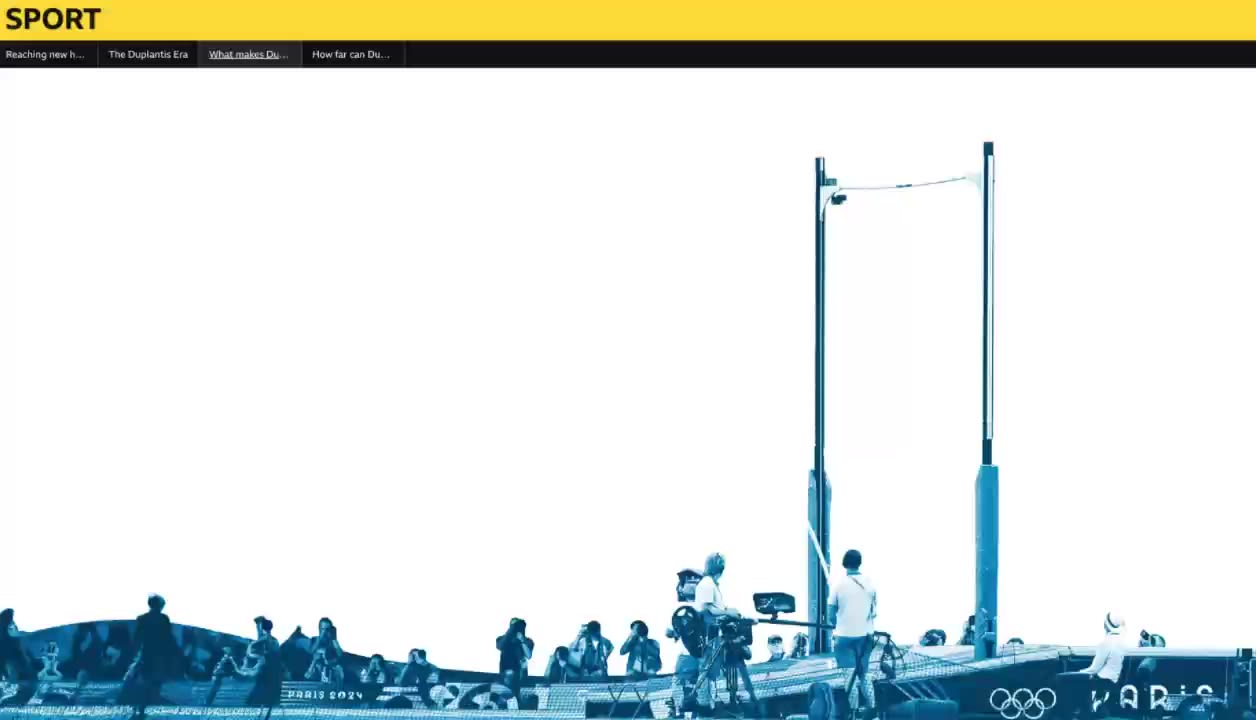
Reveal
If you want to create a fully immersive reading experience, why not turn the entire screen into an interactive graphic? The Reveal section offers a range of transition effects between full-screen media panels. It’s ideal for immersive scrollytelling.
BBC Sport's fantastic feature article on pole vaulter Armand 'Mondo' Duplantis does this perfectly, creating a range of different scrolling reader experiences. Our favourite is the pole vaulting graphic — Mondo completes his run-up and vault as the reader scrolls.
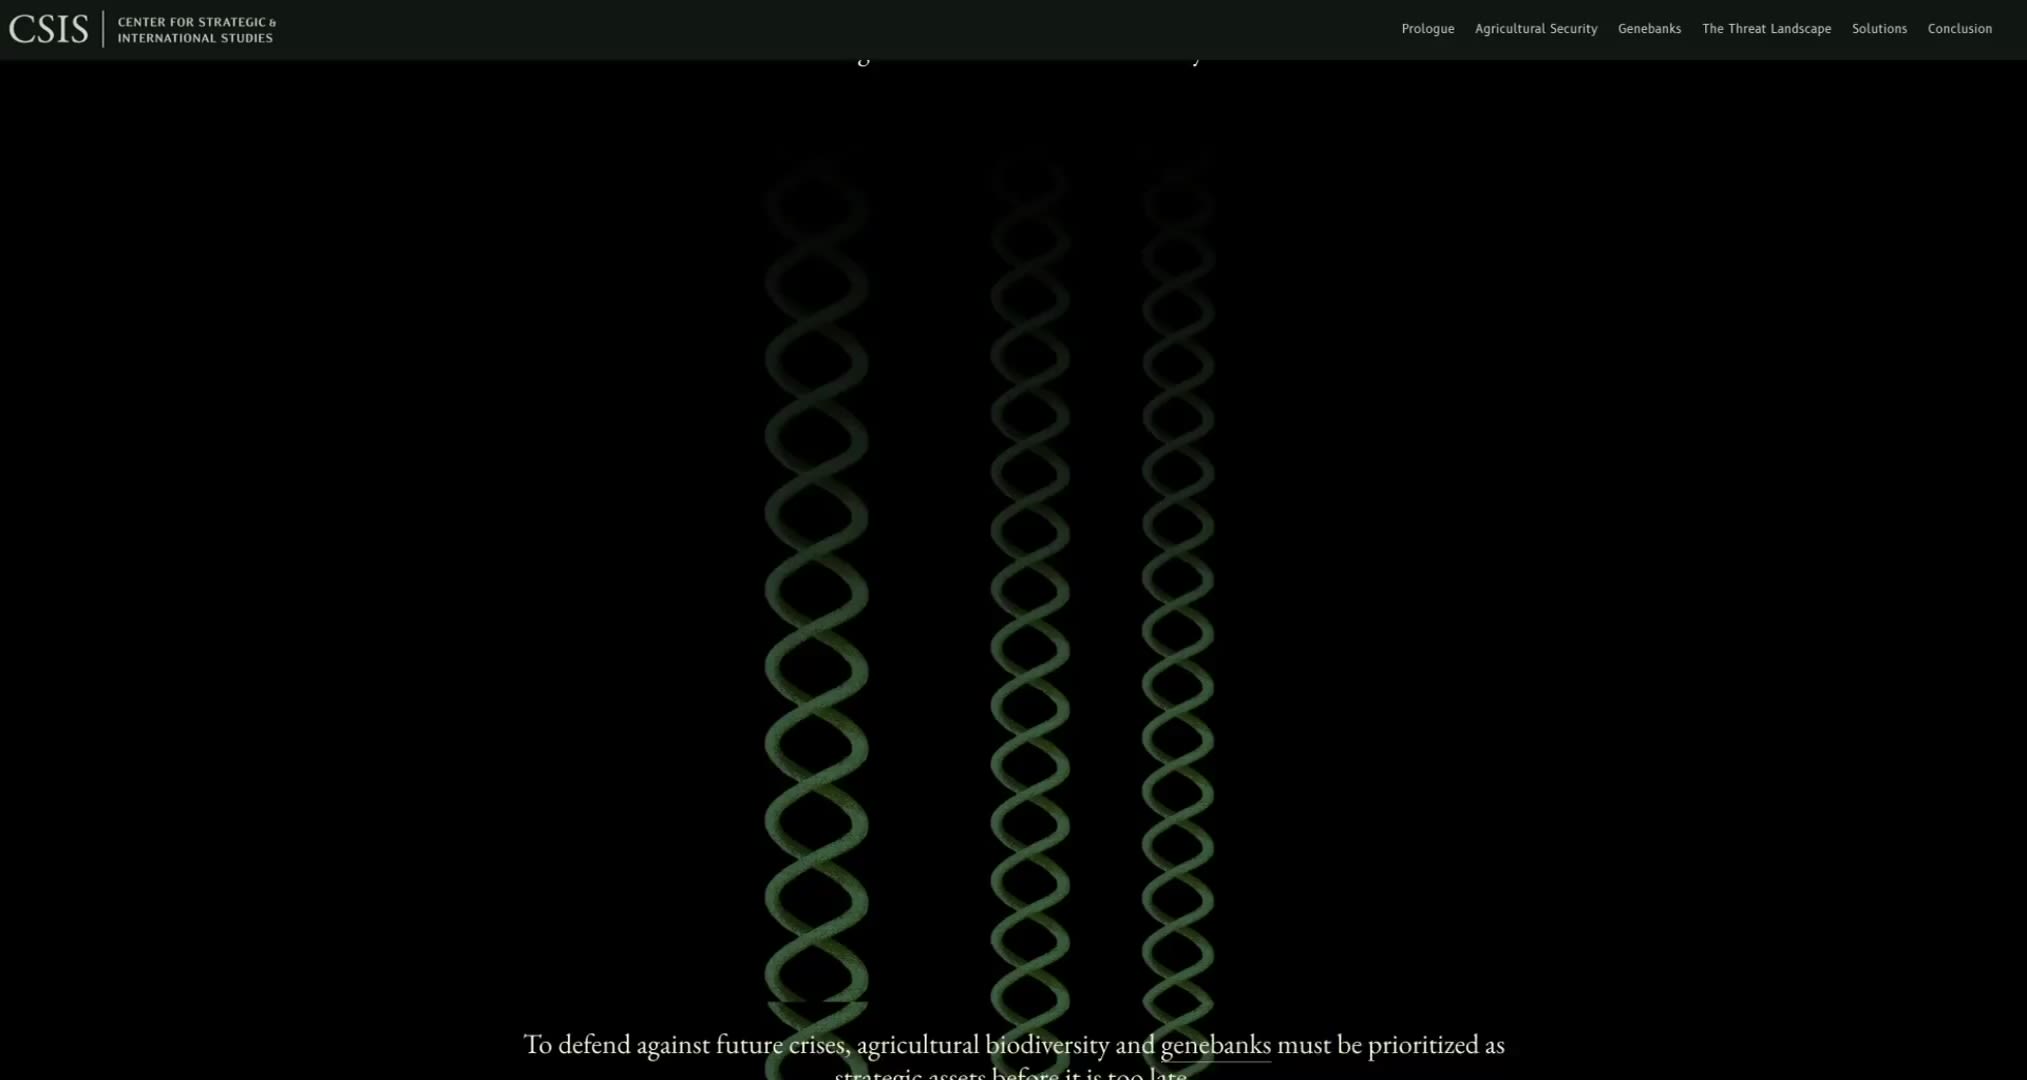
Background Scrollmation
The Background Scrollmation section allows you to overlay a text column onto full-screen background images. The text can be positioned left, right or centre.
When you opt for more than one background image, the act of scrolling through the section steps the viewer through the images, slideshow style. The slideshow effect can be used to add multiple visuals to match the text, or to create simple animations.
In 'The nature of strength', CSIS, the Center for Strategic International Studies, created this terrific panning effect in a seed bank, using Background Scrollmation.
Scrollmation
Shorthand's other Scrollmation section works in either two-column or two-row format, depending on whether you're viewing on desktop or mobile. Generally speaking, one column/row is occupied with text, and the other with visuals.
Similar to Background Scrollmation, when you supply more than one image, the images transition as you scroll.
On mobile, you also have the option of placing the images inline — that is, in the most meaningful static positions within the text column.
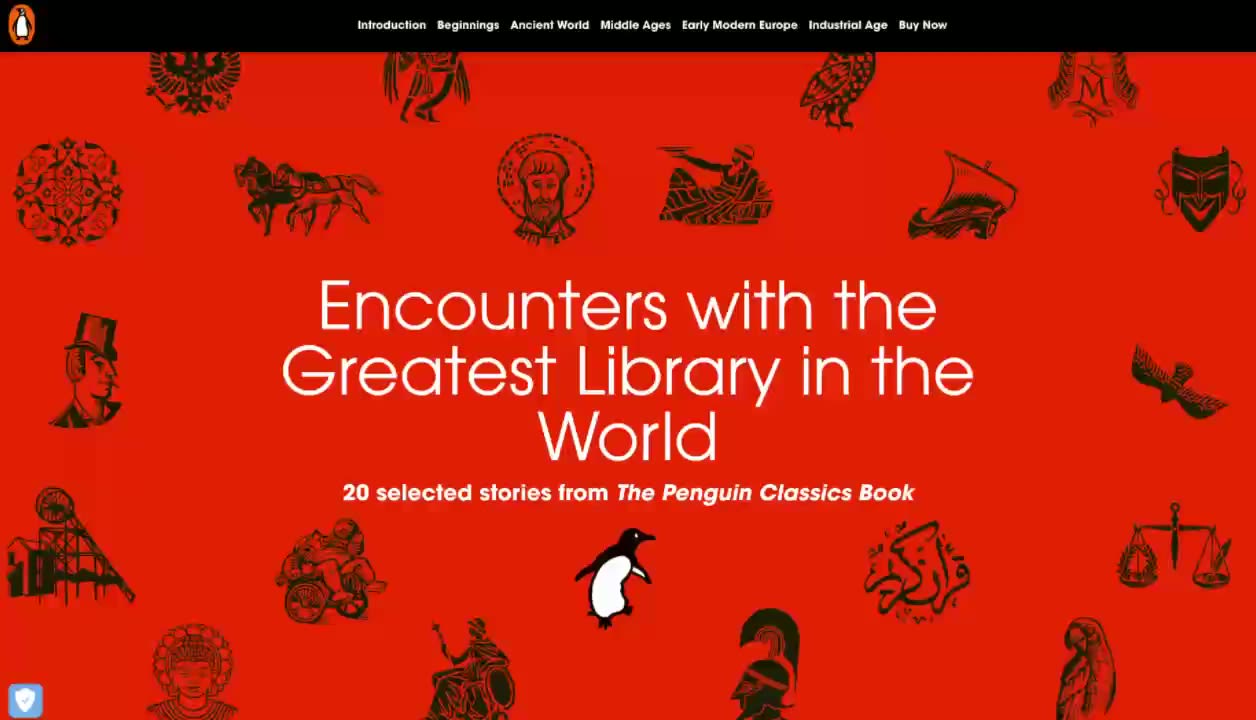
Encounters with the Greatest Library in the World, by Penguin Books, uses Scrollmation to show book covers throughout the ages, and allows the reader to easily compare the book covers by scrolling up and down in their own time.
Frequently asked questions
What are interactive graphics?
Interactive graphics are any type of visual story element that responds to a user action, such as scrolling, hovering, or clicking.
What’s the difference between interactive graphics and interactive infographics?
Interactive graphics can include photos, illustrations, or videos. Interactive infographics are a type of interactive graphic that explains or demonstrates information — such as a dataset, a process, or a workflow. We have a guide to interactive infographics, too.
Do interactive graphics require coding?
No. Interactive graphics can be built with code, but the examples in this story are all built in Shorthand, the no-code digital storytelling platform.
How many frames/images should I use for scroll animation?
It depends on the graphic and the tool you’re using. It’s important to storyboard the interactive experience you’re designing so you can pace out the scrolling media against other on-page elements like text, and determine how many frames you need and the speed at which they should cycle.
How do I make interactive graphics work on mobile?
Different screen sizes affect both the experience and how you need to build your interactive graphics. It’s important to test often on both desktop and mobile as you build so you can catch issues early.
In Shorthand, you can build sections twice—once for desktop-only view and once for mobile-only view. For mobile-specific images, try placing images inline (within the text column). If you’re using a feature like Scrollmation, consider the ‘two-row Scrollmation’ option.
Do interactive graphics increase engagement?
Absolutely. Recent Shorthand research found an 8% increase in engagement (both time on page and scroll depth) for stories that included interactive elements. Read the report.
Are interactive graphics good for storytelling?
Absolutely. Interactive and visual elements can boost engagement, recall, and comprehension. They’re also more shareable, which can lead to additional positive results for your content.
What makes an interactive graphic successful?
A successful interactive graphic should impart knowledge or entertain while encouraging the reader to keep moving through the story. Design-wise, it should match the timing and colour palette of the story, brand, or masthead it sits under. It should also be tested and optimised on both desktop and mobile so it works smoothly across screen sizes.