Content marketing metrics: an introduction for content teams


Reporting on the right metrics is one of the most important things to get right in content marketing. This is because these metrics have an outsized impact on your priorities.


By Matt McGregor
By Matt McGregor
If you report primarily on organic traffic volume, for example — and are getting high-fives for those big numbers you’re pulling in — you’re unlikely to invest in thought leadership content, even if that’s a better investment for your business.
In this guide, we’ll run through the most important content marketing metrics. This will help you get better at reporting on the impact of your content marketing program.
We’ll cover:
Start creating with Shorthand
It's the fastest way to publish beautifully engaging content marketing, reports, internal comms, and more.


What are content marketing metrics?


Content marketing metrics are systems of measurement that help you understand how your content is performing.
Ideally, these metrics help you understand the impact of your content, track your progress towards your marketing goals, and make data-driven decisions to improve your strategy.
Content marketing metrics are ideally a subset of the metrics the marketing team as a whole will report on. These, in turn, are ideally a subset of the metrics the business reports on to its executive team and board.
… Ideally.
How to decide which metrics to pay attention to


The difficulty with content marketing metrics is that there are so damn many of them. This is a problem for digital marketing in general.
Analytics tools like Google Analytics offer many different ways to measure and report on content performance. Other marketing tools — such as Hubspot or Marketo Engage — offer even more data for content marketers.
For some metrics, like brand awareness, you might find that there is no single tool that will get you the number you need.
So how do you know what to pay attention to? Unfortunately, there are no absolutes, but a basic rule is that your metrics should help you do a better job and build a case for content marketing ROI (return on investment).
Here are some questions to ask yourself:
- Does this help me contribute to our marketing goals? Your marketing team should have a documented strategy, and that strategy should list strategic priorities and key performance indicators (KPIs). Learn them, as your content needs to make a material contribution to them — that’s your job.
- Is this an area I should improve? There’s no point obsessing over backlinks and domain authority if you’re solely focused on paid campaigns. Remember, your metrics should help you improve your content marketing efforts.
- Can I measure this easily? Some metrics, like social media shares and newsletter signups, are relatively easy to measure using built-in analytics tools. Different metrics, like lead generation and conversion rates, may require more advanced tracking systems.
- What are my peers measuring? While every content marketer is different, it’s worth learning from peers who are working on similar problems. To be clear, we’re not suggesting that you copy all the latest trends on LinkedIn. Instead, grab a coffee with someone you respect and learn what they pay attention to.
- Do I have a choice? Not all content marketers get to choose what they report on. This can be a problem, and sometimes leads to perverse incentives. Unfortunately, this is common across the profession. To prioritise better metrics in this situation, you need political nous, seniority, or a track record of success.
Remember, the metrics you choose to measure should be specific to your business and marketing goals. It's important to regularly review and update your metrics as your strategy evolves.
How to report on content marketing


Once you have identified the metrics you want to track, it's important to report on them consistently — even if you’re not sure anyone is paying attention.
This point is crucial, and it’s worth dwelling on. Often, it can feel like no one is paying attention to content marketing. But someone will, sometime, and they’re going to come with a bunch of probing questions. It can be unwise, professionally, not to have answers on hand.
As Tracey Wallace says, it’s worth operating with a healthy sense of paranoia.
But what’s the best way to go about it? Again, there are no hard and fast rules, and content reporting frameworks vary from team to team. That said, there are some general rules by which to abide.
- Tell a consistent story. Content marketing projects typically don’t deliver results immediately. Be prepared to patiently explain what you’re doing, and why, month after month.
- Be prepared to show your working. Your reporting will necessarily show high-level trends. But someone, sometime, will want to dive into your data. It’s best to have it close to hand.
- Show the bad news. One counter-intuitive way to build credibility with executives is to be open about failure.
- Visualise your data. Use charts, graphs, and tables to visually represent your key metrics. This makes it easier for stakeholders to understand and interpret the metrics you are tracking.
- Explain your progress. Give a qualitative update about what you’re focusing on, what you’ve learned, and what you have planned — without giving a laundry list of tasks. Remember: No one cares how busy you are. They just care that you are getting closer to achieving results for the business.
A helpful formula for measuring content marketing ROI
To calculate content marketing ROI, start by summing your costs. These could include:
- creation spend (for example: freelance budget)
- promotion spend (for example: paid social)
- tools budget (for example: a digital publishing platform)
Subtract total costs from the sales (or gross profit) you can confidently attribute to content marketing campaigns. The resulting figure is your net profit. Then divide net profit by total costs to get ROI.

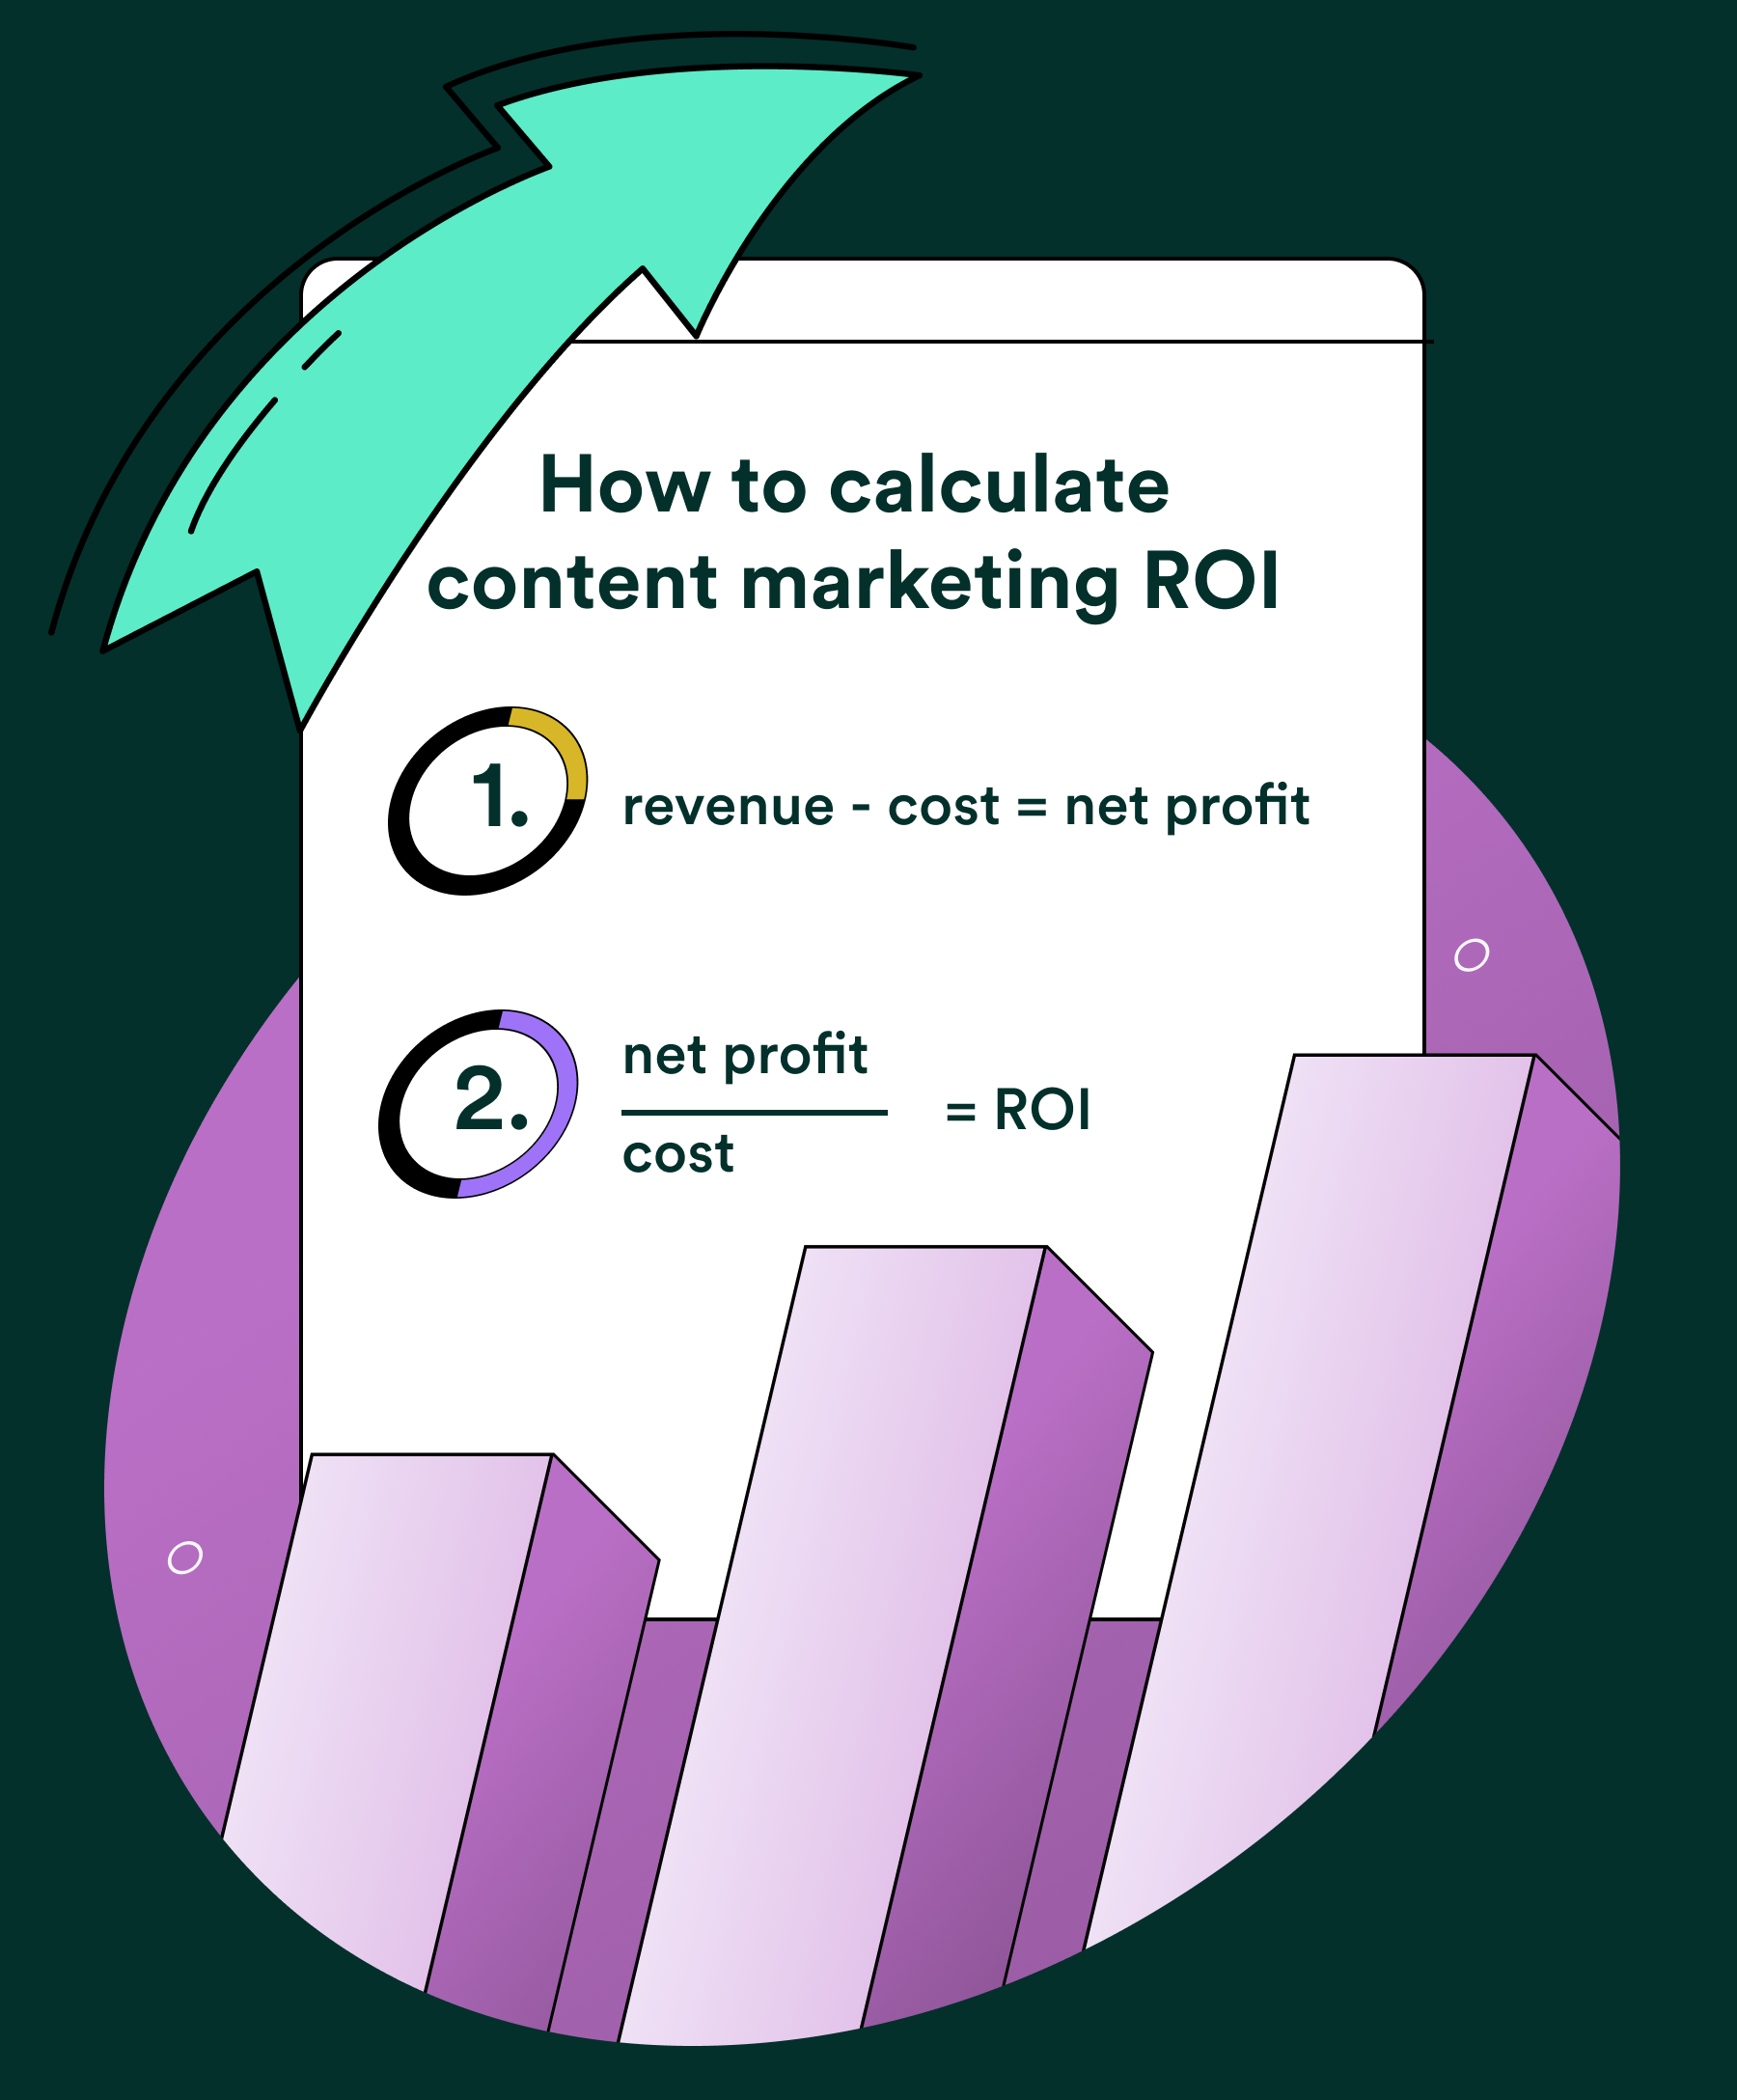
This formula gives you overall content marketing ROI. The next step is to break your strategy into tactics (for example: paid social, blog content, podcasts) and calculate ROI for each. This helps you identify which areas are costly, which are effective, which need a rethink, and which deserve increased investment.
Content marketing metrics and how to track them


The list of different content marketing metrics is long. Below, we break them into categories:
- Traffic and SEO metrics
- Engagement metrics
- Distribution metrics
- Conversion metrics
- Brand metrics
- AI/LLM visibility metrics
- ROI metrics
Traffic and SEO metrics
Organic traffic
Organic traffic is a subset of website traffic that shows the number of people who come to your website through search engines. It indicates how well your content is ranking in search engine results pages (SERPs) and — more specifically — how many people are clicking through to your site.
To track organic traffic, use tools like Google Analytics. Monitor organic search traffic over time for changes or trends. A decline in organic traffic may indicate a need for SEO optimisation.
Keywords
In addition to tracking organic traffic, you should monitor your performance in SERPs. This includes tracking your rankings for relevant keywords and monitoring changes in your search visibility.
Use tools like Google Search Console, Semrush, or Ahrefs to track keyword rankings.
Views per user
Previously referred to as ‘Unique pageviews’, GA4 no longer includes a direct ‘Unique Pageviews’ metric. However, it’s still useful to measure the number of unique users who viewed a specific webpage during a given period. Unlike total Views, which include repeat views from the same user, Users provides a clearer picture of your audience size.
In GA4, use Users alongside Views for each page. Views per user can help indicate how often the same user views that page (including repeat views within the same session or across multiple sessions).
Backlinks
Backlinks are links from other websites that point to your content. They’re an important metric for measuring the authority and quality of your content. Backlinks indicate that other websites find your material valuable and are willing to reference it.
Track backlinks using tools like Google Search Console or third-party backlink tools, including Semrush or Ahrefs.
Content decay
Content decay refers to the gradual decline in a piece of content’s performance over time. As an article ages, it may see drops in traffic and SERP rankings and, in some cases, increases in bounce rate.
Measure content decay by tracking long-term content performance and identifying declines in engagement, traffic, or rankings — particularly for content older than 6–12 months.
You can reduce content decay by refreshing content regularly with updated facts and figures, fixing dead links, earning new backlinks, improving internal linking, and adding sections that better match current reader intent.
Engagement metrics
Time on page
Time on page measures how long visitors spend on a specific page. A longer average time on page suggests your content is engaging, while a shorter average time may indicate a need for improvement.
Use tools like Google Analytics to track average time on page for key pages on your website.
Pages per session
Pages per session refers to the average number of pages a user views during a single visit. This metric provides insight into the depth of a user’s interaction with your site.
Measure pages per session in analytics tools like Google Analytics.
Bounce rate
Bounce rate is the percentage of sessions that were not engaged. In GA4, a session is considered engaged if it lasts 10 seconds or more, includes two or more page/screen views, or records a conversion.
A higher bounce rate can suggest users aren’t finding what they expected, the page isn’t encouraging further action, or there are usability/performance issues—but it can also be normal for pages designed to answer a question quickly.
In older Universal Analytics, bounce rate was based on single-page sessions.
You can track bounce rate in Google Analytics 4 reports.
New visitors
New visitors are individuals who access your website for the first time during a specific period.
You can measure new visitors in tools such as Google Analytics, which distinguishes between users who have previously interacted with your site and those engaging for the first time.
Returning visitors
Returning visitors are users who come back to your website. This can be a strong signal that your content is building brand awareness and loyalty.
Measure returning visitors in analytics tools like Google Analytics, which show repeat visitation behaviour over time.
Distribution metrics
Newsletter open and click rates
Newsletter open rate measures the percentage of subscribers who open your email. This can indicate the effectiveness of your subject lines and the relevance of your content. Track it using email marketing software.
Newsletter click rate (or email CTR) measures how many recipients click links within your email after opening. It indicates interest in the content and strength of your calls to action. Many email platforms allow A/B testing of subject lines, send copy, and creative.
Note: open rates can be less reliable than they used to be due to privacy features that may inflate opens, so clicks and downstream actions are often more meaningful.
Social following
If social media is an important distribution channel for you, track follower count and changes after posting — both short-term spikes, and longer-term trends once you’ve established a consistent cadence.
Measure social following in each platform’s native analytics, or across platforms with a tool like Hootsuite or Buffer.
Social engagements
Track engagement actions such as likes, comments, shares, saves, and reposts. This helps you understand whether your social strategy is working — and whether your content and brand voice are resonating with your audience and their networks.
Measure social engagement in native platform analytics, or with a tool like Hootsuite or Buffer.
Conversion metrics
Click-through rate
Click-through rate (CTR) measures the percentage of people who click a specific link. In content marketing, CTR is often used to assess the effectiveness of headlines, meta descriptions, in-email links, ads, and call-to-action (CTA) buttons.
To calculate CTR, divide the number of clicks by the number of impressions (the number of times the link was shown).
Track CTR using tools like Google Analytics, Google Search Console (for organic SERP CTR), or social/email analytics platforms. Monitor CTR over time and experiment with different approaches to improve it.
Newsletter signups
Newsletter signups measure the number of people who subscribe to your email newsletter. You can also identify which channels and content pieces drive the most signups.
Track newsletter signups using email marketing software and/or analytics tools.
Leads
Leads measure the number of potential customers who have shown interest in your products or services. This metric indicates how effective your content is at generating demand.
Track leads using forms, marketing automation platforms, and CRM software, and make sure you can attribute lead source (for example, by campaign tagging and consistent UTMs).
Assisted conversions
Assisted conversions highlight the interactions a customer had with your content before the final (last-click) conversion. These touchpoints — like blog posts, webinars, or social posts — help influence someone to convert later.
In GA4, you can review assisted conversions and compare assist versus last-click contribution to understand how your top-of-funnel content supports revenue.
MQL
For brands using lead generation, marketing qualified leads (MQLs) are people who show strong interest but aren’t necessarily ready to buy. They may, for example, submit a form to access gated content.
Capture leads via lead-gen forms, contact forms, or CRM-integrated tools. Measure MQLs by defining qualification criteria (for example: ‘mid-to-senior job title at a mid-to-large sized company’ plus intent signals such as a demo request or high-intent page visits).
Learn more about lead generation in our guide: how gated content works →
Sales qualified leads and qualified pipeline
Sales-qualified leads (SQLs) are leads your sales team has assessed as ready for a sales conversation. Qualified pipeline typically refers to the value of sales opportunities that have progressed to an agreed stage.
A strong SQL rate from MQLs suggests your content is attracting the right audience and setting appropriate expectations.
Sales and opportunity conversion rates
In B2B marketing, sales are the end goal — and sales revenue figures also help you calculate content marketing ROI. Opportunity conversion rates measure how successfully your sales team turns leads into opportunities and then closed deals. High conversion rates here are a strong signal that your content marketing is driving qualified demand.
Brand and demand metrics
Branded search lift
This measures whether a campaign increases searches for your brand name — often a sign you’re driving awareness and curiosity (not just clicks).
You can estimate this using Google Search Console by comparing branded query impressions/clicks before and after a campaign.
Direct traffic trend
Direct traffic is traffic GA4 can’t confidently attribute to another source. It often includes typed URLs, bookmarks, and untagged links — but it can also include misattributed traffic due to missing UTMs, redirects, certain apps, ad blockers, or tracking issues.
Measure direct traffic in GA4 and treat sudden spikes as a prompt to review tracking hygiene (UTM usage, redirects, cross-domain tracking, HTTPS consistency, and internal traffic filters).
Share of voice
Share of voice compares your brand’s visibility against competitors across a channel (for example: organic search, social, or PR). It helps you spot competitive threats and identify where you’re gaining or losing attention.
In general terms, you measure it by dividing your visibility (impressions/mentions/coverage) by the total visibility across the market or competitor set.
Tools like Semrush and Ahrefs can estimate SEO share of voice, while Brandwatch, Talkwalker, and Sprout Social can help measure share of voice on social and across the web.
Sentiment
Brand sentiment measures the overall feeling (positive, negative, or neutral) people associate with your brand. In content marketing, it helps you evaluate audience response and the emotional tone of feedback.
Measure sentiment with social listening tools and reader surveys (qualitative insight), then cross-reference with behavioural metrics (traffic, engagement, conversions) to validate whether sentiment shifts correlate with performance changes.
AI and LLM visibility metrics
AI and LLM metrics include brand mention frequency, citation rate, and content attribution. These additional metrics are outlined in our guide to AI search ranking tools, and below.
Brand mention frequency
How often your brand is referenced in AI answers and other AI-surfaced summaries across relevant topics.
Citation rate
How often AI answers cite your website (or content) as a source — typically measured as the percentage of relevant AI results that include your domain as a cited reference.
Content attribution
How consistently your brand is clearly credited when your ideas, frameworks, or content are surfaced — especially when the AI answer paraphrases rather than directly quoting or linking.


Content marketing metrics FAQs
What’s the point of tracking content marketing metrics?
The right metrics help you measure impact, shape priorities, and make smarter strategy decisions. They keep reporting grounded in business goals — not just vanity numbers like raw traffic alone.
How do I know which metrics matter for my team?
Ask: does this metric help you contribute to your documented marketing goals? Will it help you improve your content or make better decisions? Can you measure it reliably with your tools and tracking setup?
Not every metric matters to every team — focus on those that help you drive performance and make a case for content’s value.
Are some metrics better than others?
There’s no universal “best” metric. Some metrics — like organic traffic — indicate visibility, while others — like conversions — show business outcomes. Which are most important depends on where your strategy is focused and what outcomes you’re trying to influence.
What’s the difference between measuring and reporting?
Measuring is collecting data. Reporting is telling a story with it. A good report highlights trends, shows context, and doesn’t hide bad results — because stakeholders need a realistic performance picture over time.
Should I share all my metrics with stakeholders?
Not necessarily. Lead with metrics that tie to strategic goals and outcomes, and have deeper data ready for people who want to explore further. Consistency and clarity matter more than overload.
What should I do if leadership only cares about vanity metrics?
It’s common for teams to be stuck reporting on metrics that don’t reflect real value. Keep reporting consistently, add context, and build credibility over time — even if your ideal metrics aren’t recognised instantly.
How often should I revisit my metrics?
Regular review is important because your strategy and goals will evolve. Metrics aren’t “set and forget” — update them as your content priorities and business context shift.
What tools should I use to track content metrics?
Most teams use a mix of web analytics, marketing automation dashboards, SEO and search performance tools, and CRM or conversion tracking systems. Choose tools that reliably capture the signals you care about. For helpful pointers, check out our guide, How to measure content success.
Does content marketing always produce immediate results?
No — content marketing often plays out over weeks or months. That’s why consistent reporting and trend tracking matter more than short-term wins.
What’s one common mistake teams make with metrics?
Focusing on metrics because they’re easy to measure — instead of those that link to business priorities. Make sure what you track helps you understand value and improve your work, not just fill a dashboard.
Which content marketing metrics matter most for B2B?
This varies by brand, but sales and marketing alignment is critical. Once your traffic and engagement metrics are in good shape, focus on aligning goals and tracking so your MQLs reliably feed a strong sales pipeline (and you can prove it with attribution).
How often should you report on content marketing?
Some metrics — like email engagement or timely social performance — can be tracked frequently. Others, like ROI and content decay, need a longer view. Schedule regular weekly or monthly check-ins for fast-moving channels, and deeper quarterly or biannual reviews for trends, ROI, and strategic decisions.
How do you measure content marketing ROI?
Use the formula: (sales revenue or gross profit – costs) = net profit, then divide net profit by costs to get ROI. Calculate ROI multiple times — once for each content marketing tactic — to understand what’s working and what’s expensive.
What should you track if organic traffic is declining?
Review your target keywords and rankings, and compare your content to competitors to spot optimisation opportunities. Look for ageing posts and content decay — updating facts, examples, and imagery can help performance recover. Also remember search algorithms change frequently, and AI-driven search experiences may shift clicks away from traditional results — so keep an eye on conversions and ROI, not just traffic. And familiarise yourself with how to optimise your content for AI search systems.
There’s a lot to remember when it comes to keeping up with your content marketing metrics. But the skills and tools required to do it are not difficult to master — the hardest part is staying organised. Begin with a good routine, so you are tracking, measuring, and optimising as you go along, and you’ll be making your case and informing future content decisions in no time.
Start creating with Shorthand
It's the fastest way to publish beautifully engaging content marketing, reports, internal comms, and more.