Special report: What’s working on Shorthand?


We've crunched the numbers on a year's worth of Shorthand stories. Here's what works, what top-performing stories look like, and more.


by Joe Martin and Ben Ice
by Joe Martin and Ben Ice
Creative teams using Shorthand often reach out to us for data on what’s performing well on our platform and what best-in-class reader engagement looks like.
We’ve heard your calls and are excited to share insights from a deep dive into the performance of 54,140 stories published with Shorthand.
Our findings reveal how readers consume digital media and what makes a story highly engaging.
In this special report, we’ll dive into:
Start creating with Shorthand
It's the fastest way to publish beautifully engaging stories, content, digital magazines, and more.


Engagement
Different stories have different goals — from driving traffic to generating sign-ups or increasing time on page. There’s no single 'golden' metric, but time on page and scroll depth (which shows how far a reader scrolls) can help indicate whether your audience is sticking around to engage with your content.
Average engagement on Shorthand stories

122 seconds
read time
*a ‘Workspace’ is a Shorthand team account, as opposed to an individual user account, and may include a number of individual users.

33% scroll depth
View duration
Time on page (seconds)


View duration is heavily skewed towards shorter times on page (no surprises there!) but highly engaging stories buck the trend.
Most viewers drop off before 60 seconds.
Read on for practical recommendations to help you emulate top performers, plus four inspiring examples that show how it’s done.
Scroll depth percentage
Scroll depth has a U-shaped distribution.
If people read past a certain point, they are more likely to read to the end.
View duration on Shorthand stories is heavily skewed: most readers click away quickly once they’ve found the information they need or realise the article isn’t quite what they’re looking for. This aligns with broader trends across the internet.
Our takeaway? Try to get readers hooked early, during that small window of attention they give you.
Clear headlines and opening sections help set expectations — giving readers a strong sense of what your story is about, and reducing the chances they'll bounce. Strong visual design is also key. Think carefully about the elements you include above the fold, and curate your opener to pique interest and encourage readers to keep scrolling.
Who's reading, and on what device?
Desktop versus mobile
Across our entire dataset, 60% of views were on mobile and 40% on desktop.
However, for the average Shorthand customer, the bulk of their traffic (63%) still comes from desktop.
Overall, 60% of views on Shorthand stories came from mobile devices. However, the share of mobile viewership varies significantly across our publishers.
A general trend is that customers with particularly large audiences — such as news publishers — tend to have a higher percentage of mobile views. This aligns with the intuition that many readers consume news and other popular content on their smartphones.
A more typical mobile share of viewership across all of our customers in all industries is 37%.
It’s important, therefore, to consider your own audience when optimising for desktop versus mobile.
Engagement levels vary between devices, too, as you'll see below.
How mobile device influences engagement

Desktop
131 seconds average read time

Mobile
116 seconds average read time

Desktop
39% average scroll depth

Mobile
29% average scroll depth
Content types that produce the highest engagement
Shorthand stories have countless purposes and goals. Which types are readers connecting with?


Average view duration — measured in seconds — varies considerably across different content types.
Internal communications have the highest average view duration: 160 seconds per article. Editorials and feature stories follow closely behind.
Average scroll depth percentage also varies by content type.
Digital magazines enjoy the deepest average scroll depth (37%).
Top-performing stories
We know you're wondering how your content stacks up against the best, so here are our findings about what high-performing content looks like.
What are the top-performing stories?

505 stories...

in the top 20% for average view duration...
*a ‘Workspace’ is a Shorthand team account, as opposed to an individual user account, and may include a number of individual users.

and the top 20% for average story completion.
That means people read them, on average...
for at least 169 seconds...
with at least 53% scroll depth.
Looking at what these 505 high-performing stories have in common provides clues on how you can optimise your next piece of content to get the best results.
How long should your story be?
The high-performing stories leaned slightly longer than the rest.
The results on performance and content length align with broader web trends: longform content tends to perform better, though it delivers diminishing returns beyond a certain point.
Average view duration increases as the number of Shorthand sections in a story rises — up to about 15 sections — then levels off.
When it comes to completion rates, averages begin to decline once stories exceed eight sections, then stabilise after around 11 sections.
Top-performing stories used a median of 13 sections, while others in the study used a median of 10.
This aligns with general longform content recommendations — stories between 1500 and 4000 words tend to hit the sweet spot for engagement, and longer stories are more likely to rank higher in search engine results.
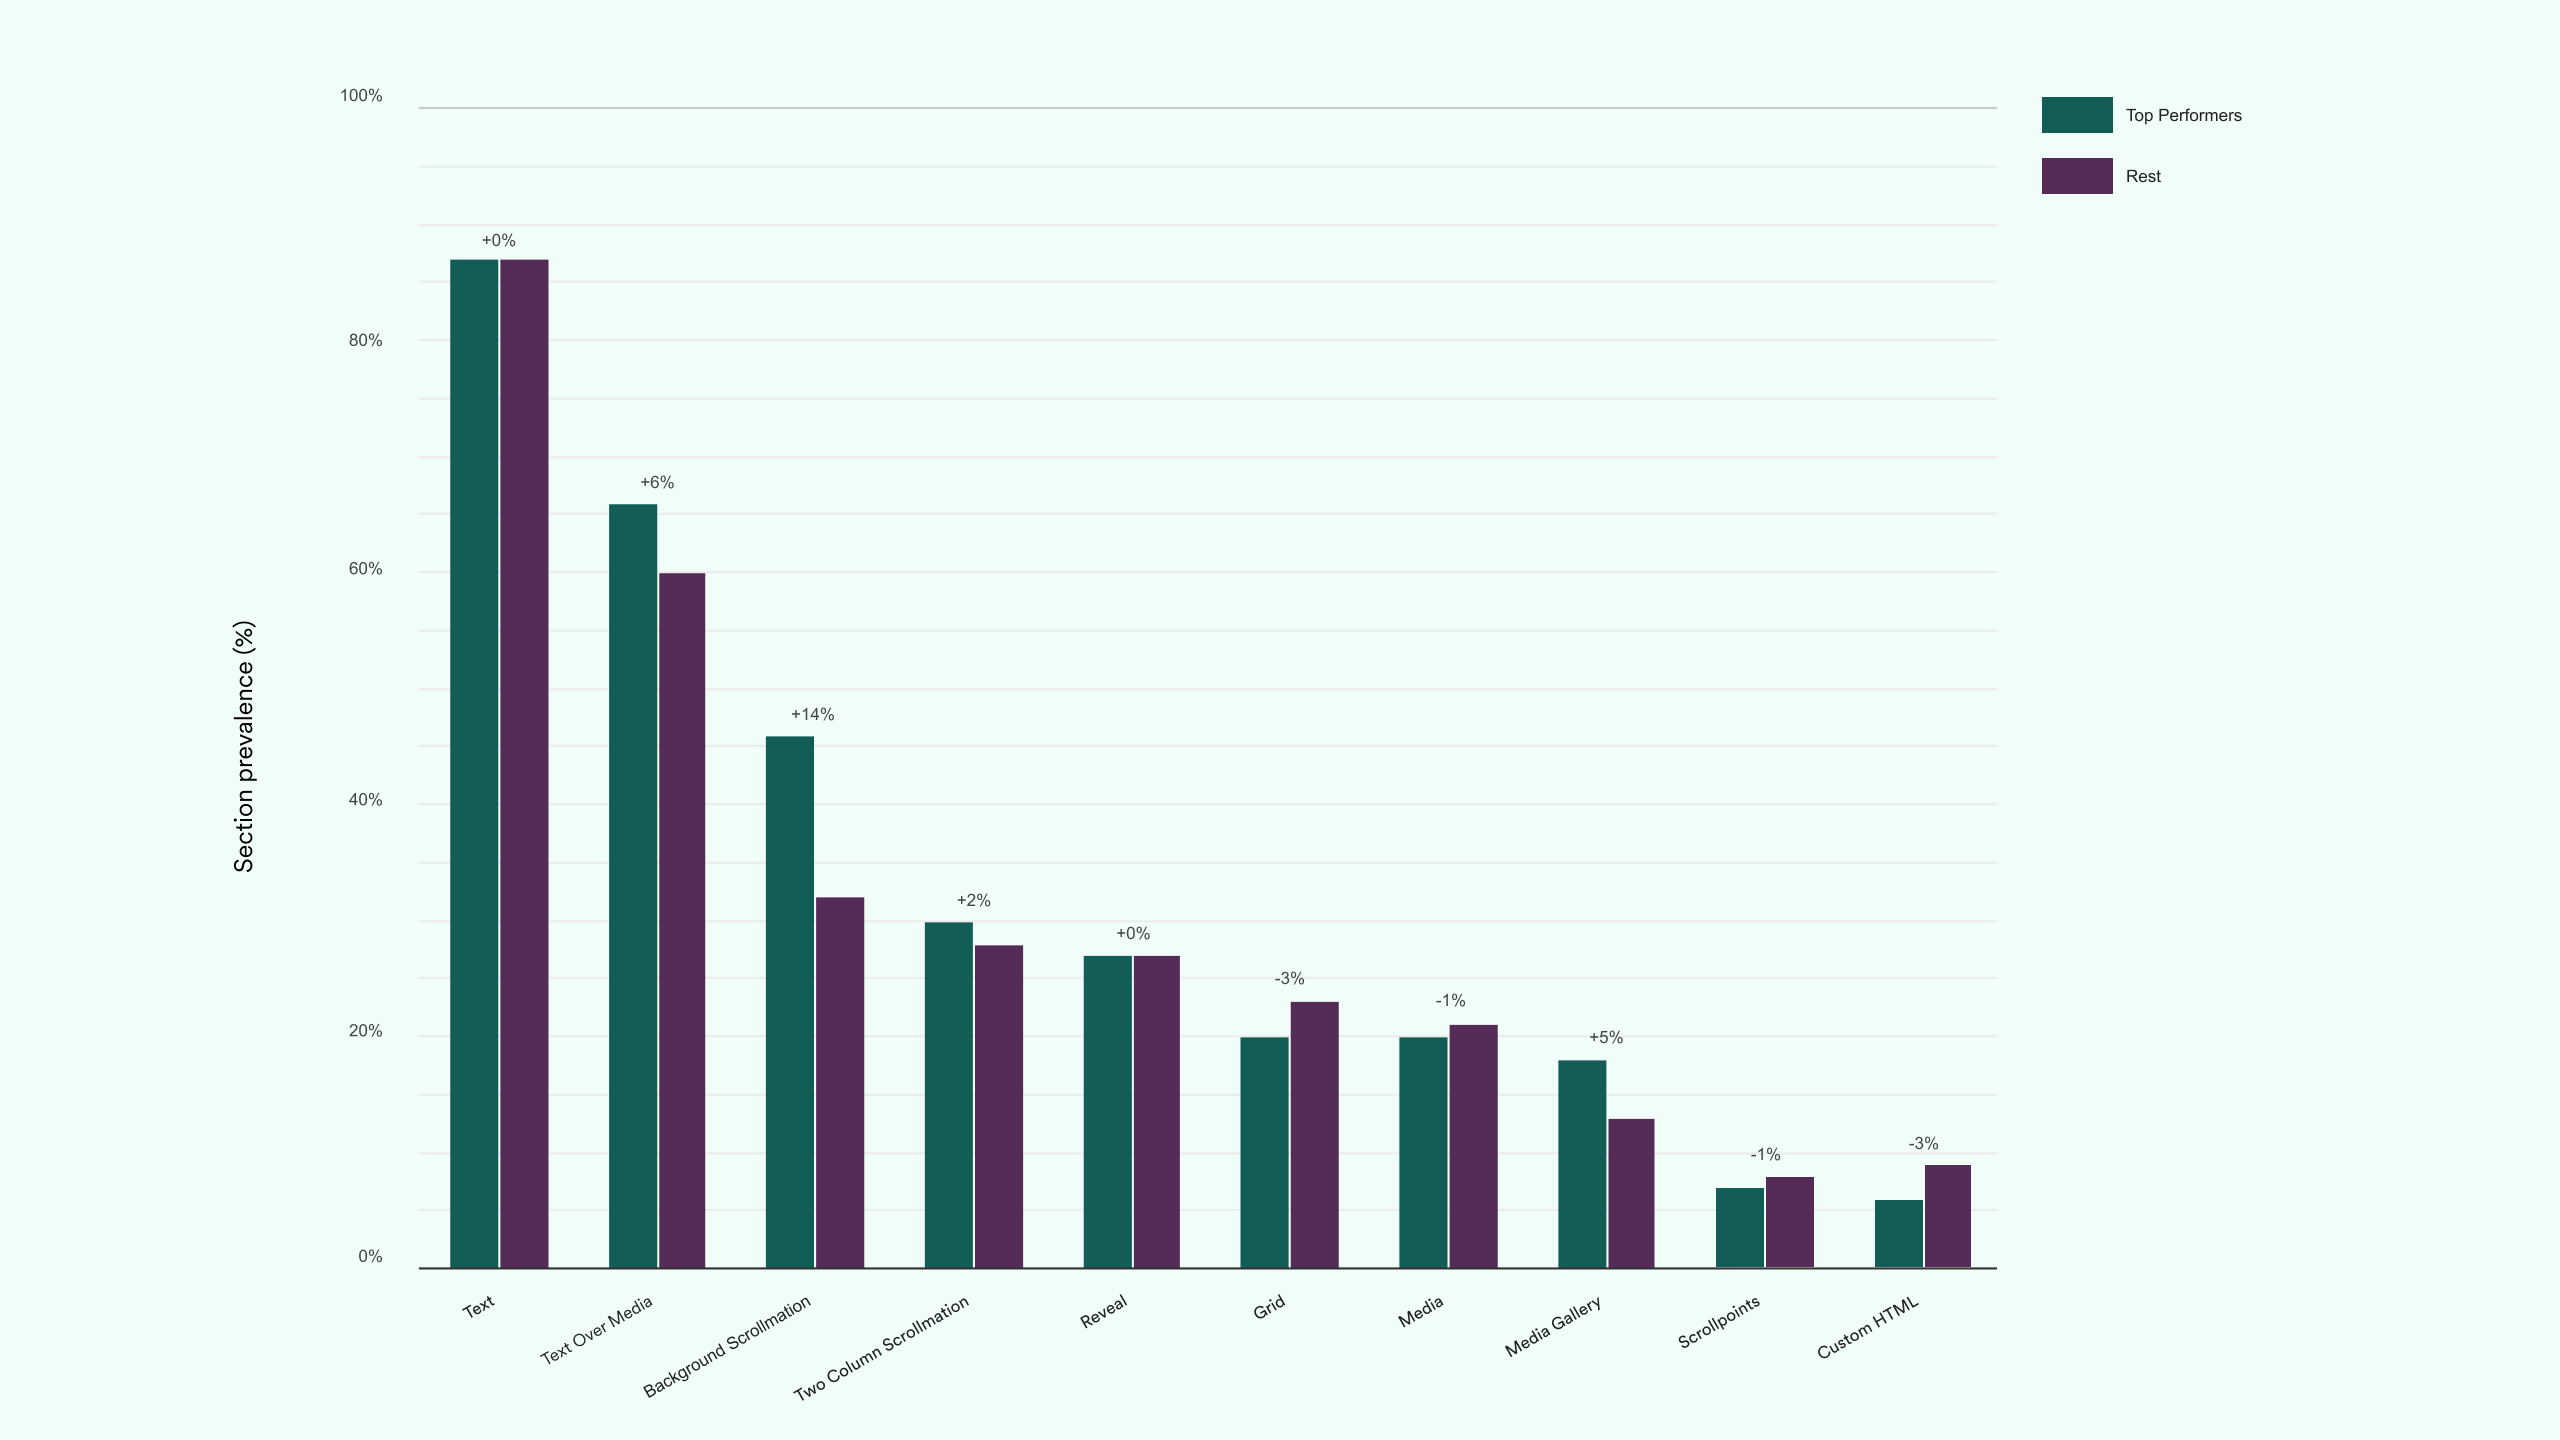
Media matters
The best articles blend rich copy with striking media. High-performing stories are 14% more likely to feature a Background Scrollmation section.
They go heavy on the media-based sections, utilising Text Over Media, Two Column Scrollmation, Reveal, and Media. The only media-based section not used more by top-performing stories is Scrollpoints.
Compare for yourself below.

Top-performing stories we love


Data is helpful, but what does best practice look like in reality? To help with inspiration for your next story, we've hand selected some favourites from our list of 505 top performers.
These stories:
- enjoyed high average dwell time and scroll depth
- sit in the ‘sweet spot’ length, using 10-20 sections
- use a range of section types, and
- come from experienced publishers that had a number of stories in the 'top performer' list.
They are also just plain fantastic! So we're not surprised readers gave them so much time and attention.
Celtic culture in England: History and legacy
By: English Heritage
Content type: Marketing comms, feature story
This history piece first does its best to define what it means for someone or something to be Celtic, before exploring the history of Celtic language and culture, and how it survived centuries of changes in Britain. It blends modern day photography with historic paintings, ornaments, and sculptures, to keep readers engaged to the end.
“We focus on creating articles that are visually engaging and easy to read,” says Chris Noyce, Content Producer at English Heritage, “so that readers can get the most from both the written content and visual media that supports it."
Living with wind turbines
By: Les Coops de l’information
Content type: Marketing comms, feature story
With engaging video of wind turbines in action, plus creative infographics, this story perfectly sums up the impact and legacy of wind turbines in Quebec.
“We want the experience to be immersive and knitted so tightly that no one wants to quit until then end,” says Kim Alarie, Digital Growth Coordinator at Les Coops de l’information of planning the visuals for Shorthand stories.
“When planning a Shorthand story, we are focusing on visual material and retaining the readers' attention by building a more attractive narrative.”
Against all odds: The Bert Trautmann story
By: Manchester City F.C.
Content type: Feature story
So many sports history articles from the early and mid-20th century only feature an old portrait or two, and maybe one shot from the game. Not this one. The short biography of Manchester City goalkeeper Bert Trautmann is blessed with a handful of action-packed photos, and uses them to maximum effect. The written story is told using Text over Media sections, the background images encapsulating the brutality and intensity of the game at the time.
The Purdue Herbaria
By: Purdue for Life Foundation
Content type: Feature story
Perhaps the most beautifully designed entry in this short list, the story from Purdue builds out its own ‘brand’ with careful attention to colour and text. The journey through the history and laboratory work of the herbaria is punctuated with illustrations of plant specimens. By cultivating a delightful experience for the reader, it maximises its chances of keeping them on page.
Mary Monical, Senior Director of Content Strategy and Editorial at Purdue for Life Foundation, speaks of the team effort required to tell this fantastic story. “I’m fortunate to work with an incredible design team that strives to make each story feel like a journey,” she says.
“Especially with longer stories, we look for ways to break the text into manageable sections so that we can sustain reader attention.”
The takeaways
- Hook your reader early
- blend fantastic text with the media types that suit your audience and available assets
- consider your readers when optimising for devices
- don’t be afraid to go long and mix it up with different media types — but forcing it will overload your reader, and
- don't try to 'game' the data.
There are lessons to be learned from this report. How can external sources of knowledge like these, combined with your own metrics and reporting, help you bring value to your readers?
Remember, data is necessary to any sound content strategy, but must not come at the expense of brilliant storytelling and thoughtful design — these are what keep readers coming back.
Dive deeper into the data behind standout storytelling
About the data
For this special report, Shorthand Data Scientist Joe Martin analysed:
- 54,140 Shorthand stories
- across 6148 customer workspaces
- published between 1 January and 31 December 2024.