Introducing Charts: Transform numbers into narratives


Numbers alone don’t inspire — stories do. We’re thrilled to launch Charts, our newest section type and inline feature designed to fuel more powerful and data-driven narratives.
It’s time to move away from static formats that lack context and engagement. Shorthand's Charts turn information into a story, guiding the audience through insights step by step.
Read on to get started, explore three game-changing ways Charts enhances your storytelling, and discover additional ways to present data.
Master the new Charts

Built to be intuitive, designed to tell a story. Now you can natively create dynamic, interactive pie, doughnut, line, and bar graphs in Shorthand as a new section or inline component.
Watch our Shorthand 101 tutorial to learn how to master Charts — from importing data to customising colours, labels, frames, background imagery, accompanying text blocks, and more. Charts is available on selected plans. Dive into the video to see it in action or speak to our team to integrate Charts into your workflow.
3 ways Charts supercharges
your storytelling
Frame your data within a narrative
Data should complement your story, not disrupt it. Static visuals often lack the depth and context to make an insight truly resonate; enter Charts.
Shorthand Charts bring data to life with smooth, web-native multi-frame animations. This guides readers through graphs step-by-step, highlighting different data points, with supporting text that reveals the "why" behind the "what." This structure shifts passive metrics into immersive, persuasive experiences — helping your audience not just see the insight, but feel its significance.
Let frames do the storytelling. Walk readers through your charts with clarity and flow.
Let frames do the storytelling—walk readers through your charts with clarity and flow.
Make complex stats instantly clear
Dense information and raw numbers can be overwhelming, especially for non-technical readers who often skim reports searching for important insights, but struggle to extract meaning.
By integrating Charts, you can communicate key takeaways without sifting through numbers. Illustrate patterns and compare key metrics — like revenue growth over time, or market share breakdowns — in a simple but bold format. Tailor chart colours, labels, frames, and more to draw attention and convey meaning instantly.
Draw attention and deliver meaning instantly with customisable colours, labels, and more.
Draw attention and deliver meaning instantly with customisable colours, labels, and more.
Spark emotion, drive action
Data analysis uncovers valuable findings, but translating them into compelling actions can be challenging. Without context or emotional resonance, even critical points risk being overlooked.
Bridge this gap with effective data storytelling using overlaid text blocks. Draw a meaningful connection between information and action, like tying customer satisfaction rates to areas of improvement, or financial performance with strategic recommendations.
A powerful chart doesn’t just inform — it moves your audience. Use impactful background imagery, set the mood with light or dark mode, and highlight key data points to guide stakeholders toward real-world decisions.
Use text boxes to add context that connects your data to meaning and action.
Use text boxes to add context that connects your data to meaning and action.
More ways to amplify data
Beyond Charts, here are more layouts and section types to help you present information in an engaging format.

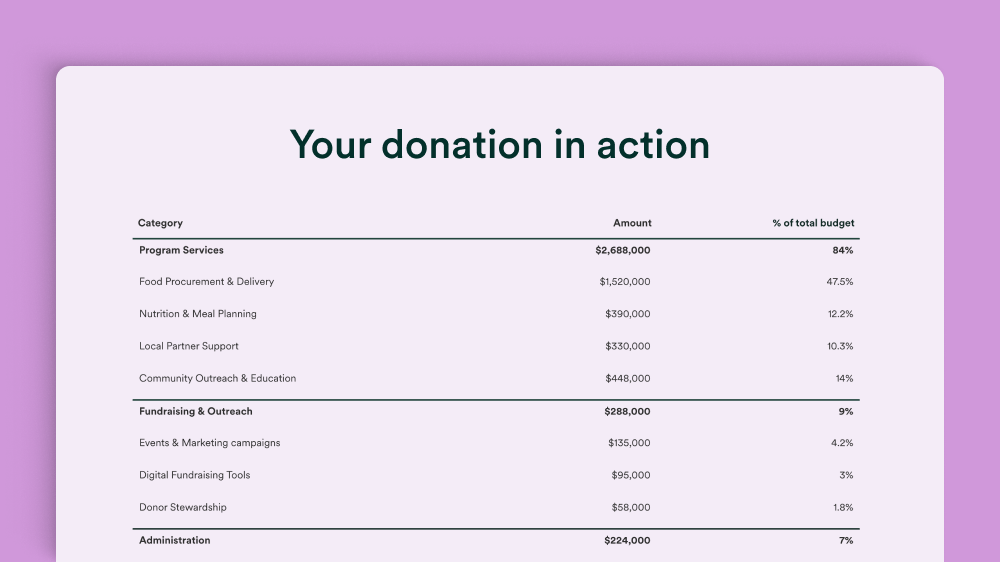
Compare at a glance
Use tables to lay out numbers neatly for easy comparison in a digestible format.
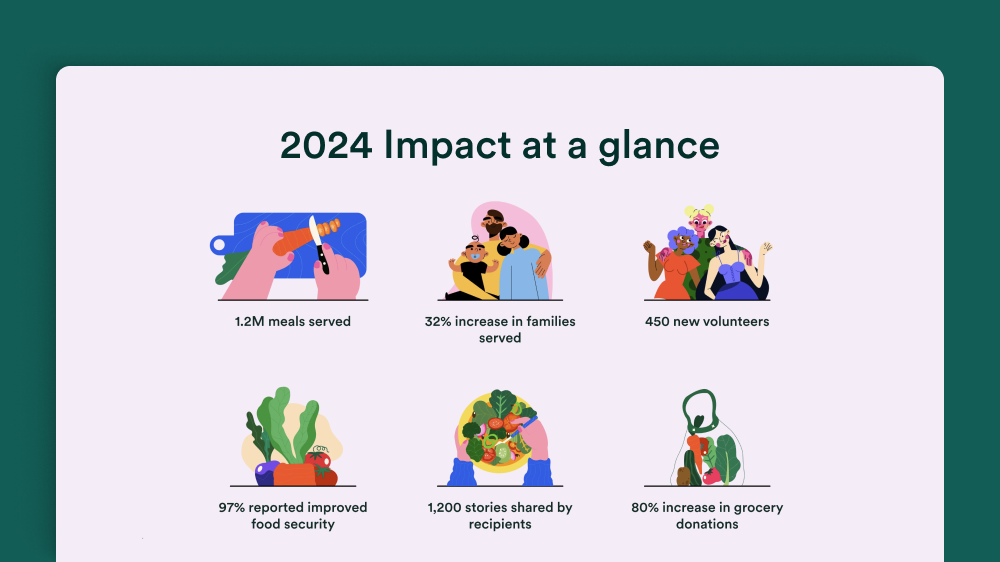
Balance visuals and text
The Grid section arranges images and words in a visually balanced and beautiful layout.

Unfold complex ideas
Scrollmation sections let you pair complex information with multi-media, scrollable content.
Ready to transform your data into visual stories that resonate?
Watch our Shorthand 101 tutorial to get started with Charts, or connect with our team for access to all of these powerful visualisation tools.